TrendCharts India

Sale!
, ,

Price Pattern Scanner

Original price was: ₹15,000.00.Current price is: ₹6,000.00.

🔎 Real-time multi-asset scanning – Stocks, Forex, Commodities
🕒 All timeframe support – 1 Min to Monthly
📊 Pattern detection – Head & Shoulders, Double/Triple Tops, Wedges, Triangles
📉 Auto-detect long & short trade setups
📈 Support & Resistance mapping from pattern structure
📋 Centralized dashboard – all signals in one place
🖱️ One-click chart access
🔔 Alerts – Popup, Email, Sound, Push
🎛️ Custom filters – Pattern, Timeframe, Signal Age, Direction
🧩 Asset selection – Focus on stocks, forex, or commodities
📅 Filter by signal recency
📦 Compatible with NSE, MCX, Forex, Options
📌 Sort by symbol, timeframe, direction

⚙️ Key Features

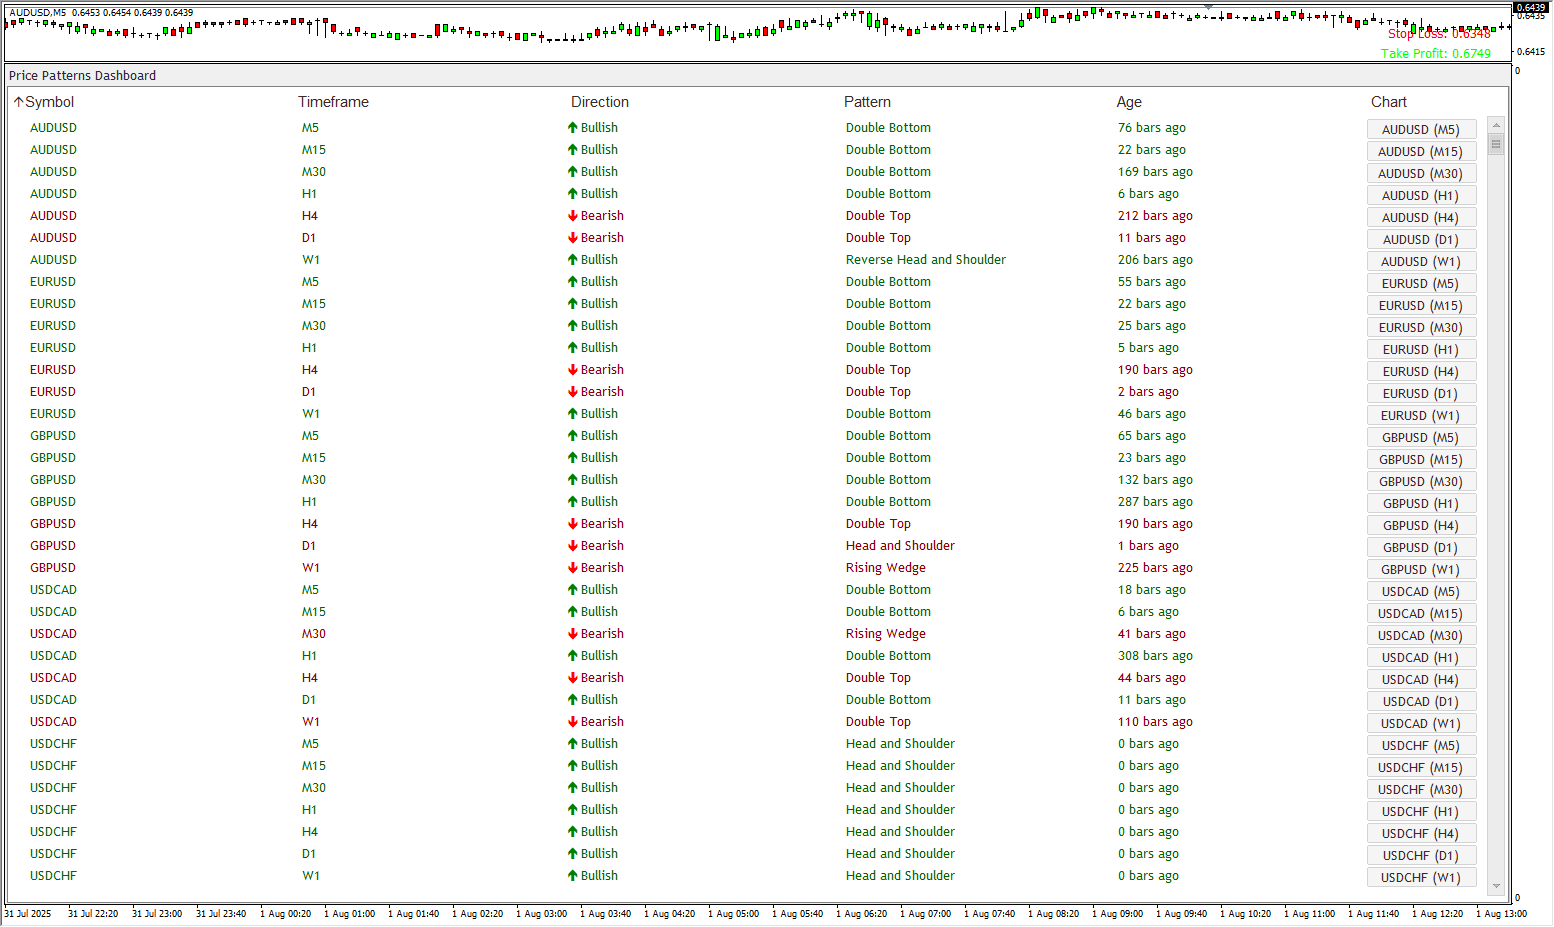
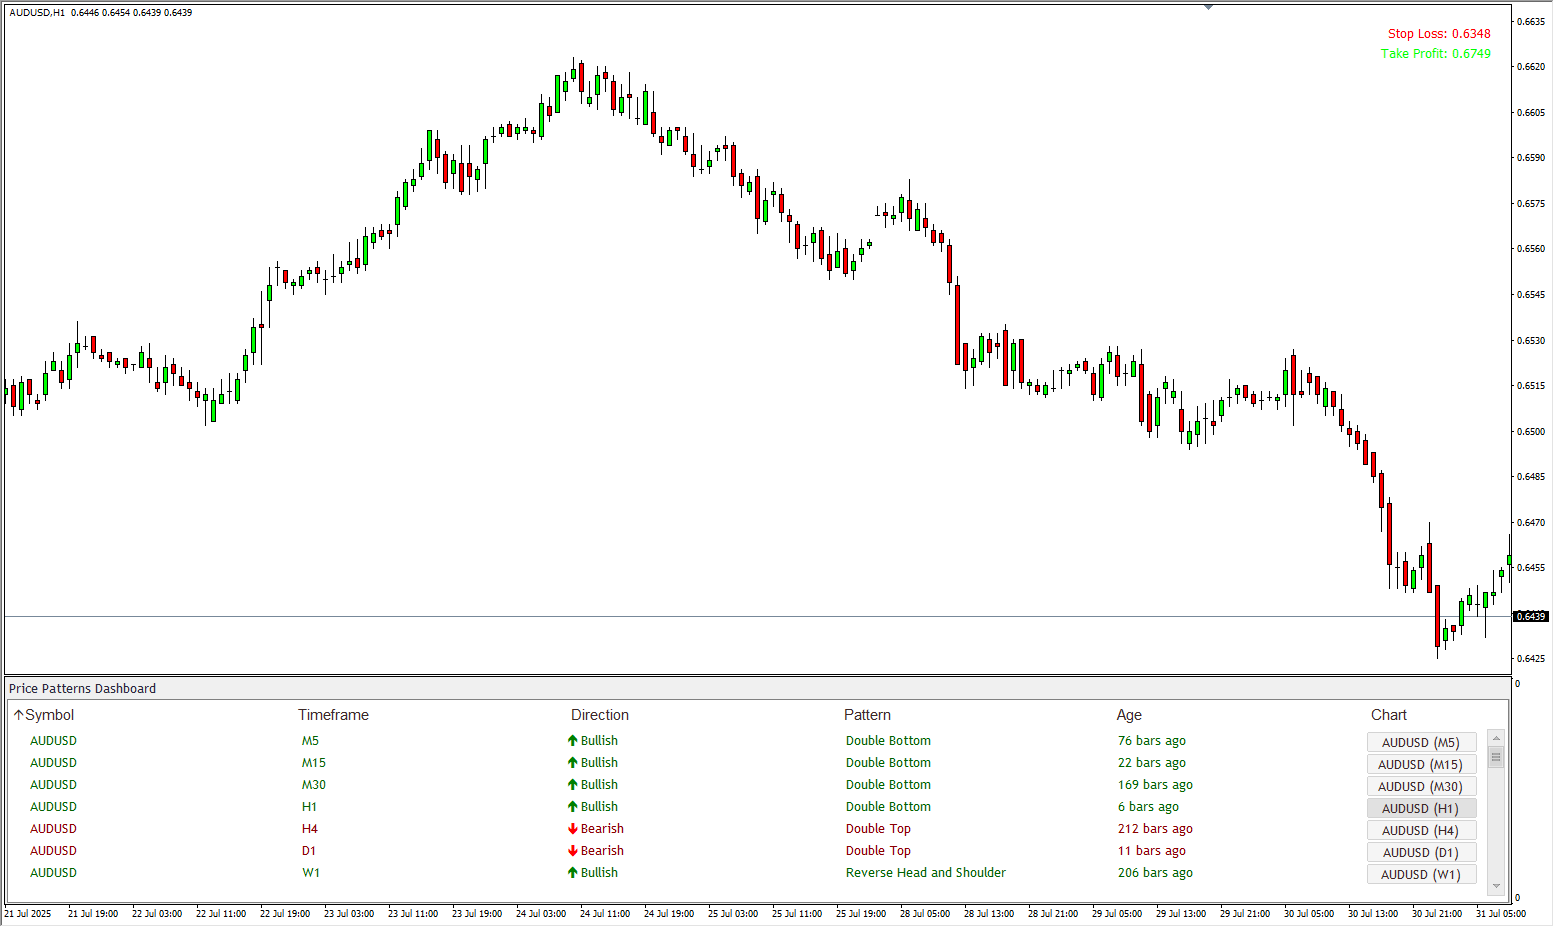
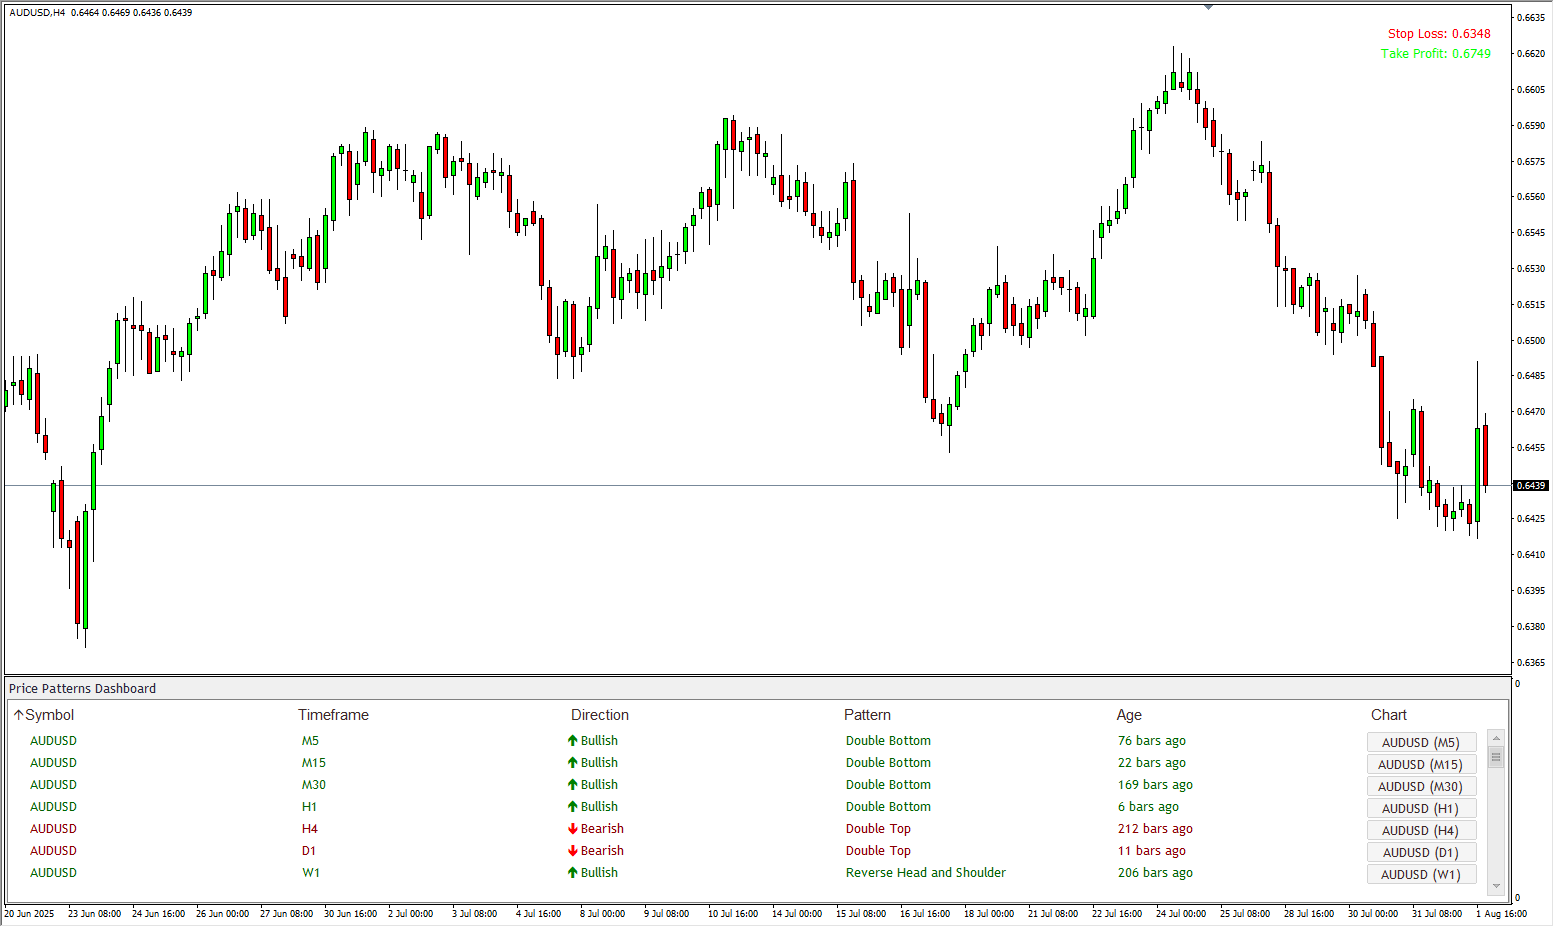
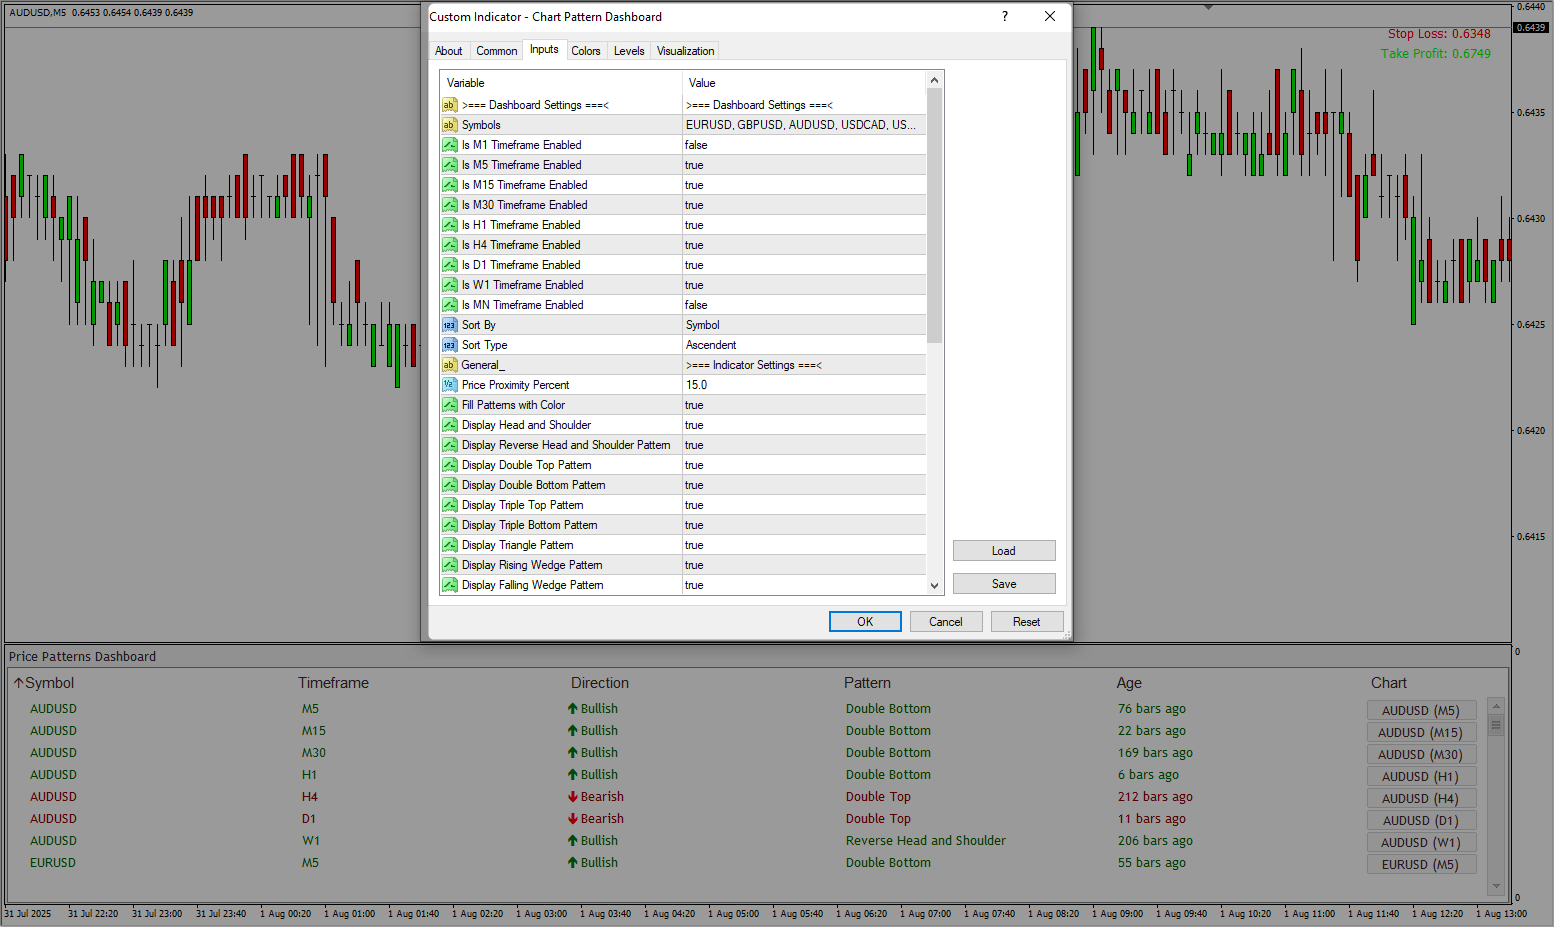
    • 🔎 Multi-Script & Timeframe Scanning
      Monitor multiple symbols (stocks, forex, commodities) across timeframes from 1 minute to 1 month — all at once.
    • 📊 Price Pattern Detection
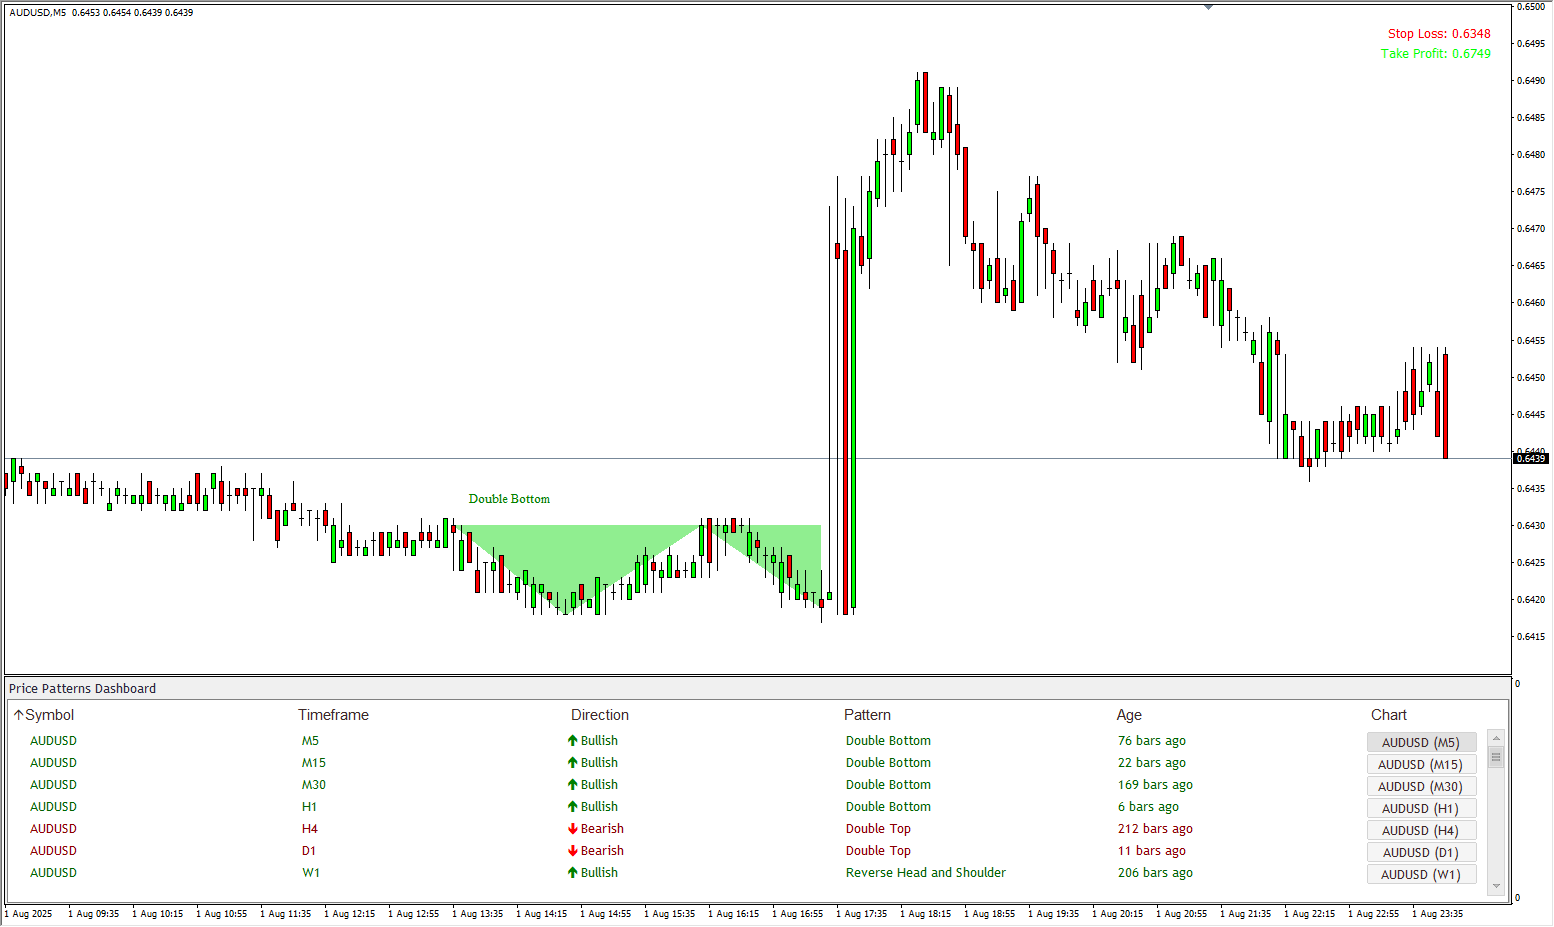
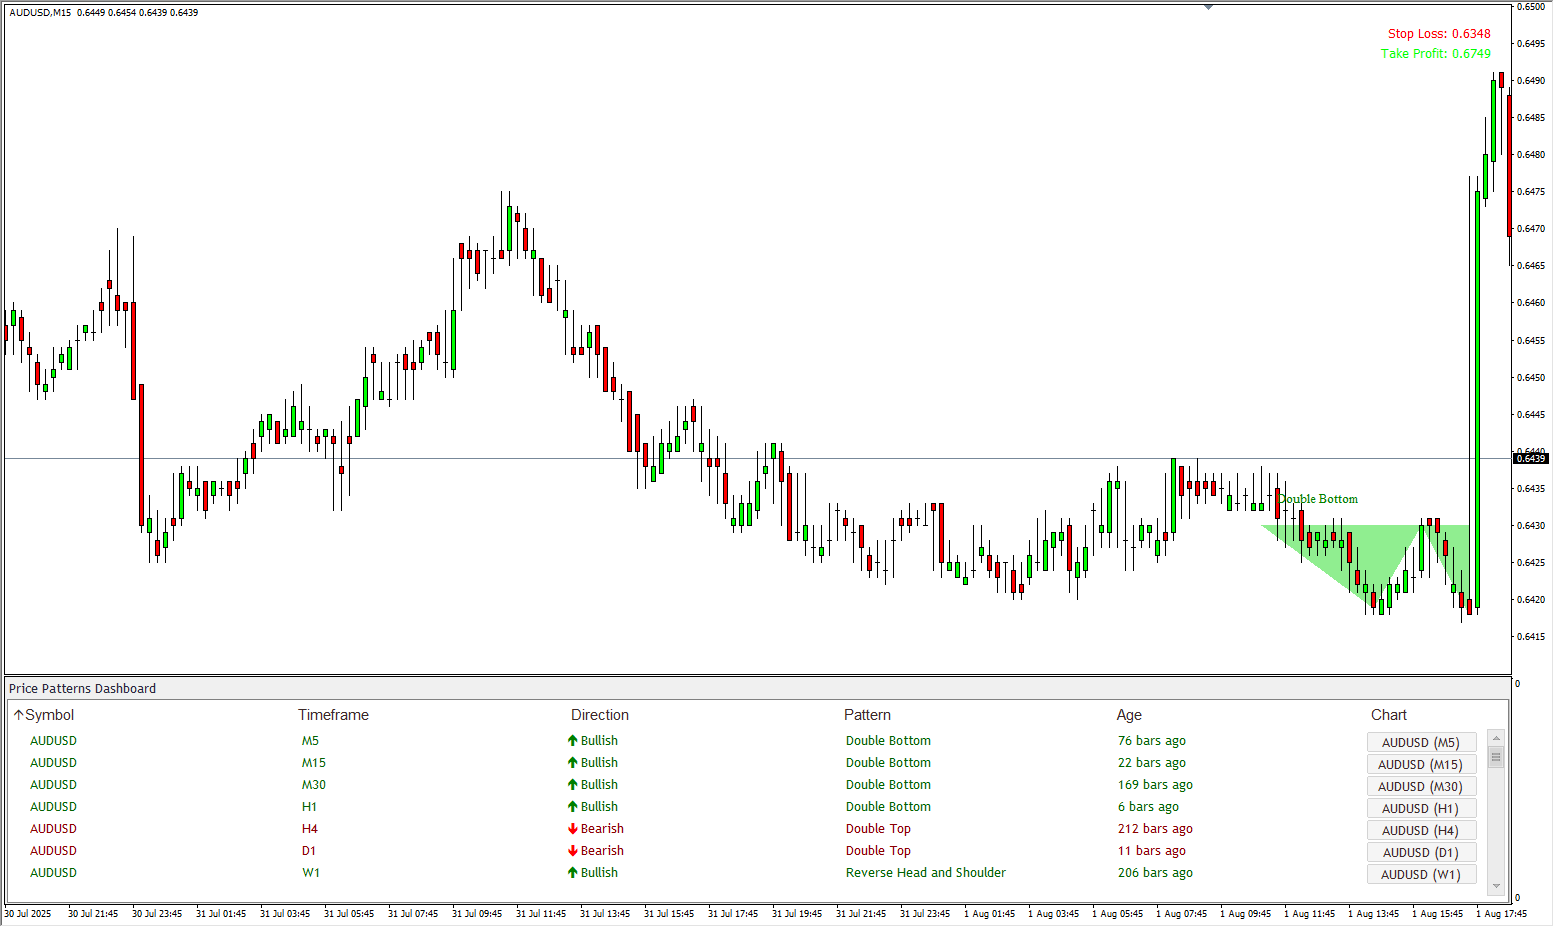
      Automatically detects powerful chart formations like Head & Shoulders, Double Tops/Bottoms, and Wedges — patterns that often signal big moves.
    • 📉 Market Reversal & Breakout Zones
      Pinpoints strong turning points and momentum shifts using pattern logic — no guesswork.
    • 🧠 Auto Pattern Recognition
      Alerts you instantly when a new pattern forms — no need to manually check charts.
    • 🖼️ Visual Pattern Display
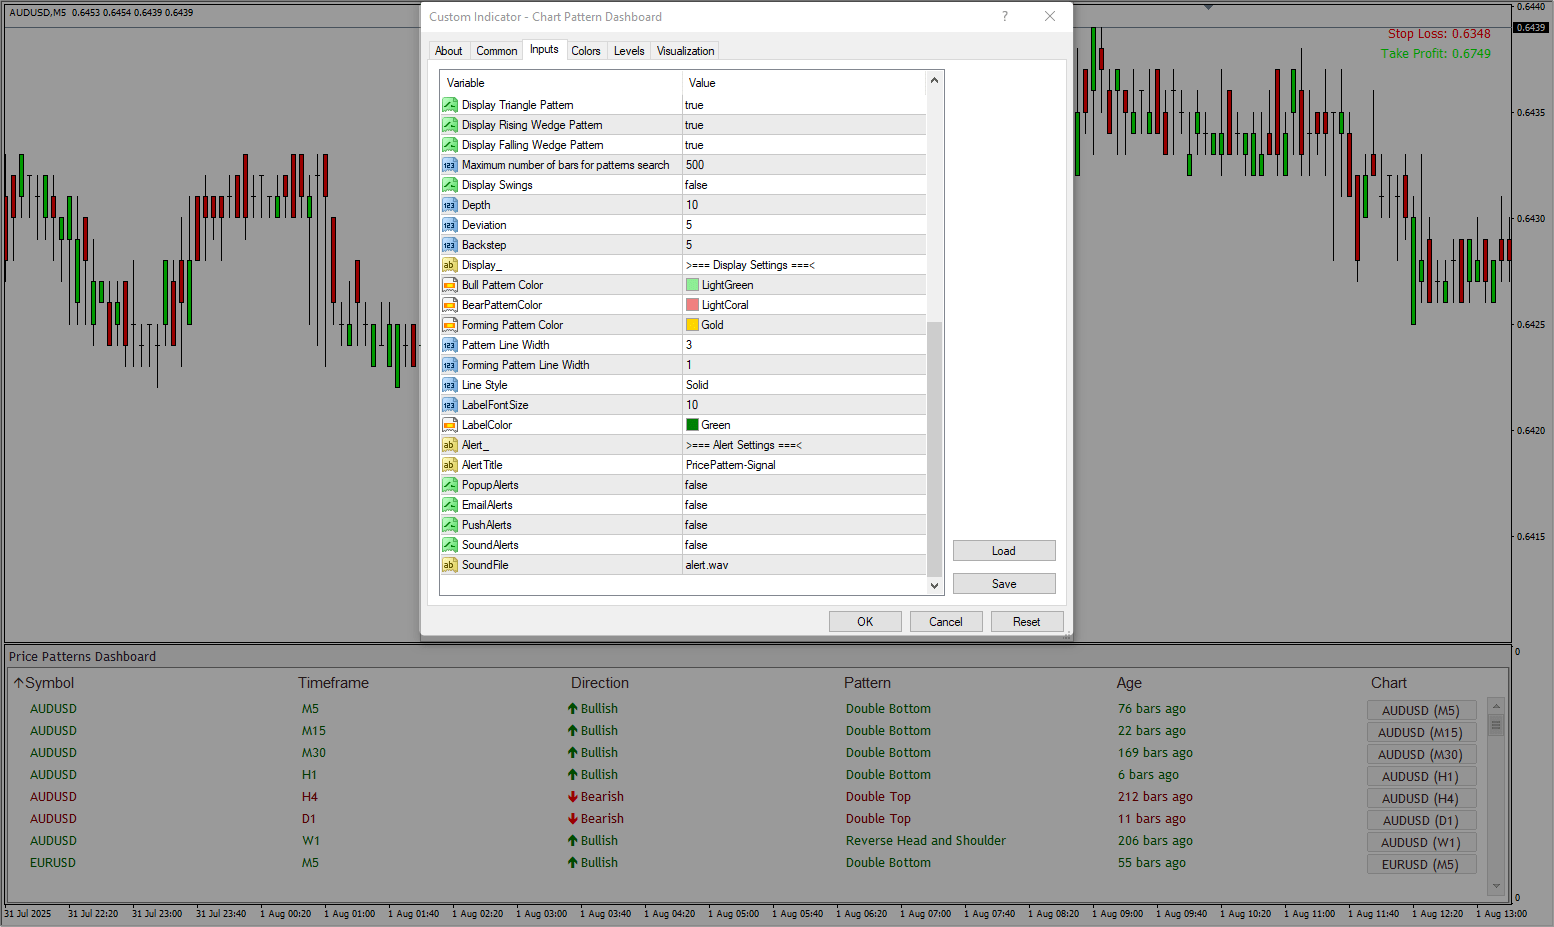
      Patterns are clearly outlined on charts with labels and shapes for quick identification.
    • 🛠️ Real-Time Smart Dashboard
      All detected patterns shown in a live-updating dashboard — stay organized and focused.
    • 🖱️ One-Click Chart Access
      Click any dashboard signal to open the chart instantly at the right timeframe and symbol.
    • 🔔 Instant Alerts
      Get real-time notifications via pop-up, sound, email, or mobile push whenever a valid setup appears.
    • 📈 Filter by Symbol, Timeframe, Direction, or Age
      Customize your view to see only the most relevant trade setups.

🧾 Supported Pattern Types

    • Head & Shoulders / Inverse Head & Shoulders
    • Double / Triple Top & Bottom
    • Falling / Rising Wedge
    • Symmetrical / Ascending / Descending Triangle

🎛️ Customizable Setting

    • 📦 Cross-Market Compatible
      Works with NSE, MCX, Forex, and Options markets.
    • 🧠 Fits Any Trading Style
      Perfect for scalping, intraday, or swing trading strategies.

Input Settings and Controls

  • 🔍 Symbol Selector
    Choose specific stocks, commodities, forex pairs, or indices to include in your scanning list.
  • 🕒 Multi-Timeframe Toggle
    Enable or disable scanning on different timeframes like 1M, 5M, 15M, 1H, 4H, Daily, Weekly, etc.
  • 📊 Price Pattern Type Selector
    Select which patterns to scan: Head & Shoulders, Double Top/Bottom, Triangles, Wedges, etc.
  • 🔁 Pattern Refresh Interval
    Set how often the dashboard should refresh to look for new pattern formations (e.g., every 1 min, 5 mins).
  • 📈 Direction Filter (Long/Short)
    Filter to view only bullish (long) or bearish (short) setups based on pattern breakout direction.
  • 📏 Minimum Pattern Size
    Define the minimum size (in price or percentage) a pattern must reach to be considered valid.
  • Signal Age Filter
    Set the maximum age of signals to show only fresh or recent patterns (e.g., within last 3 candles).
  • 🔔 Enable/Disable Alerts
    Turn ON/OFF alerts for pattern signals globally or by individual pattern type.
  • 📤 Alert Types Configuration
    Choose between Pop-up, Sound, Email, and Push Notifications.
  • 🎯 Pattern Accuracy Sensitivity
    Adjust pattern recognition strictness — higher sensitivity filters out noisy or unclear patterns.
  • 📋 Custom Watchlist Upload
    Upload your own list of symbols to scan instead of scanning full exchanges.
  • 🖼️ Chart Overlay Display Settings
    Customize how the pattern appears on the chart (line thickness, labels, breakout arrows, etc.).
  • 🎨 Color Customization
    Change the color scheme of different patterns to match your preferred chart theme.
  • 🧾 Label & Marker Controls
    Toggle visibility of pattern names, breakout levels, and projection targets directly on the chart.
  • 🔐 Save & Load Presets
    Save your preferred scanner settings as a preset and load them later with one click.
  • 🧩 Enable/Disable Specific Patterns
    Toggle individual patterns like Head & Shoulders or Wedges depending on your trading strategy.
  • 📊 Breakout Confirmation Mode
    Enable confirmation logic (e.g., candle close beyond neckline) before triggering a signal.
  • 📈 Auto-Open Chart on Signal
    Enable option to automatically open the chart of a newly formed signal.
  • 📎 Sorting Preferences
    Sort dashboard signals by symbol, timeframe, direction, or how recently the pattern formed.
  • ♻️ Restore to Default Settings
    Quickly reset all input settings to factory default for troubleshooting or fresh setup

Device Supported

Device Type Operating System Compatibility with TradingView
Windows Laptop/Desktop Windows 8 / 8.1 / 10 / 11 ✅ Fully supported via browser and app
MacBook/iMac macOS 10.15+ ✅ Fully supported via browser

Risk Disclaimer

  • 📘 This scanner is developed for educational and analytical purposes only.
  • 📊 It does not provide investment, trading, or financial advice of any kind.
  • 📈 All trading decisions made using this tool are solely the responsibility of the user.
  • ⚠️ Use of this scanner does not guarantee profits or prevent losses in any market condition.
  • 🔍 Patterns identified are algorithm-based and may not always be accurate or complete.
  • 📉 Misidentification or false positives in pattern recognition may occur due to market noise or volatility.
  • ⏳ Signals may experience delays, data lags, or technical glitches depending on internet or broker platform.
  • 🧠 Users should always verify signals manually and apply their own discretion before acting.
  • 💹 Trading based on these signals is done at your own risk, including potential capital loss.
  • 🧾 This tool is not a SEBI-registered advisory service or certified trading platform.
  • 🧪 It is intended for paper trading, simulation, and backtesting strategies, not for live money execution.
  • 🛑 The scanner is not a substitute for proper market analysis or due diligence.
  • 🧩 No real-money trade recommendations, tips, or investment advice are given.
  • 📅 Past pattern success does not guarantee future performance or outcomes.
  • 🧱 Price patterns are only one part of technical analysis and should not be used in isolation.
  • 📋 Risk management practices like stop-loss and capital allocation are essential regardless of scanner signals.
  • 📤 Notifications and alerts may not arrive in real time depending on device or platform limitations.
  • 🌐 All information and content may be subject to technical or typographical errors.
  • 🔐 Users must understand and accept the risks involved in financial market trading.
  • 🧾 Hypothetical results or backtests may not reflect actual market conditions or execution realities.
  • 🧠 Individual trading psychology, slippage, and market gaps can impact real outcomes differently.
  • 📍 The scanner does not account for macroeconomic factors, news, or personal portfolio suitability.
  • 🔧 TrendCharts.in reserves the right to modify, update, or discontinue the tool at any time.
  • 📝 Testimonials, if any, represent individual results and are not indicative of average user experience.
  • ✅ Before engaging in live trading, always consult a licensed financial advisor or SEBI-registered professional

Reviews

There are no reviews yet.

Be the first to review “Price Pattern Scanner”

Your email address will not be published. Required fields are marked *

UPI ID- trendcharts@kotak
Google Pay- 8860 575885
Phone Pay- 8860 575885
-------------------------------
A/C Transfer
BANK- KOTAK BANK
A/C NO.- 4850467174
IFSC CODE- KKBK0004661
NAME-ANKITA RAJPUT
UPI & BANK PAYMENTS
Pay & Send Screenshot on +91 8860 575885
Independence-Day-PNG-Picture

Independence Sale

Ends in
Days
Hours
Minutes
Seconds