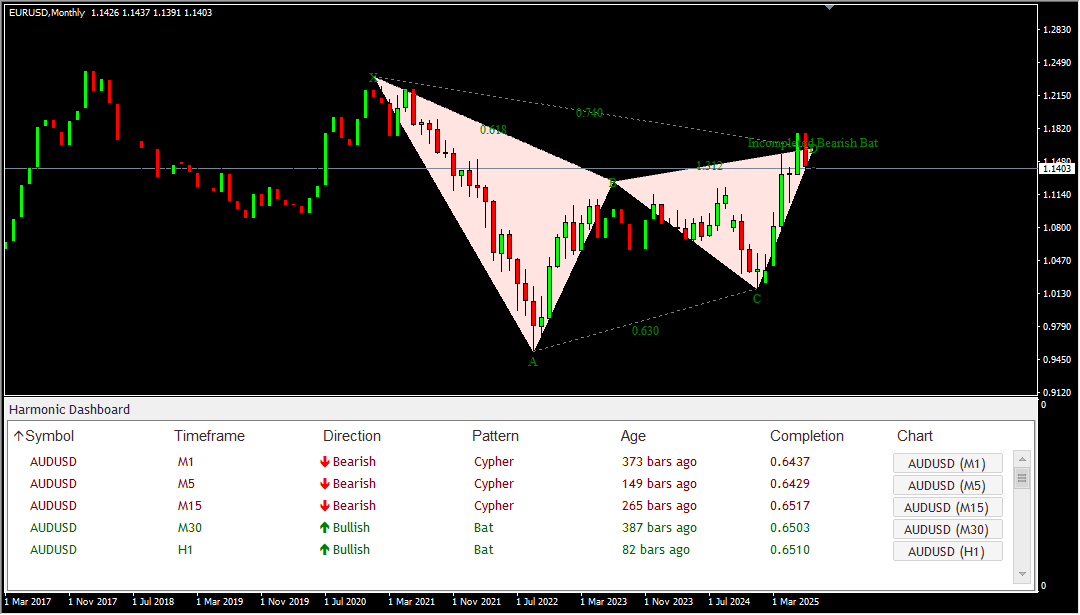
📊 Dashboard Simplifies Everything
The intuitive dashboard is designed to take the heavy lifting off your shoulders. It continuously scans and monitors market data in real time, automatically detecting complex harmonic patterns as they form. With intelligent algorithms working behind the scenes, you don’t need to spend hours analyzing charts manually—the dashboard does it all for you, saving time and increasing efficiency.
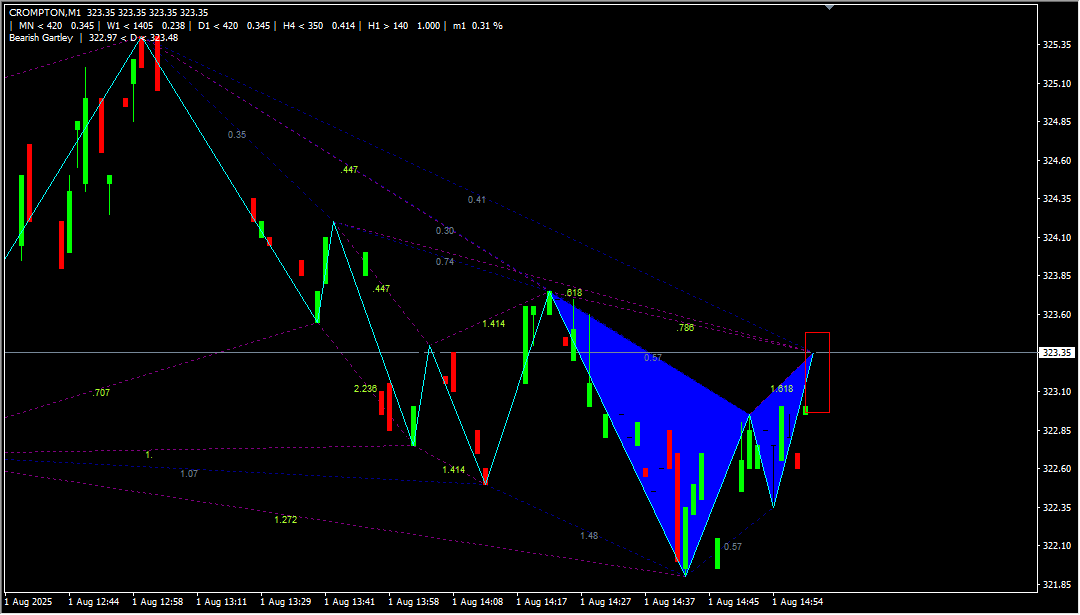
⏱️ Scan Multiple Timeframes Simultaneously
No need to limit your analysis to a single view. The scanner allows you to simultaneously scan multiple instruments across various timeframes, ranging from 1-minute charts all the way up to 1-month intervals. This feature is especially valuable for traders who monitor both short-term price movements and long-term trends, enabling a complete market overview at a glance.
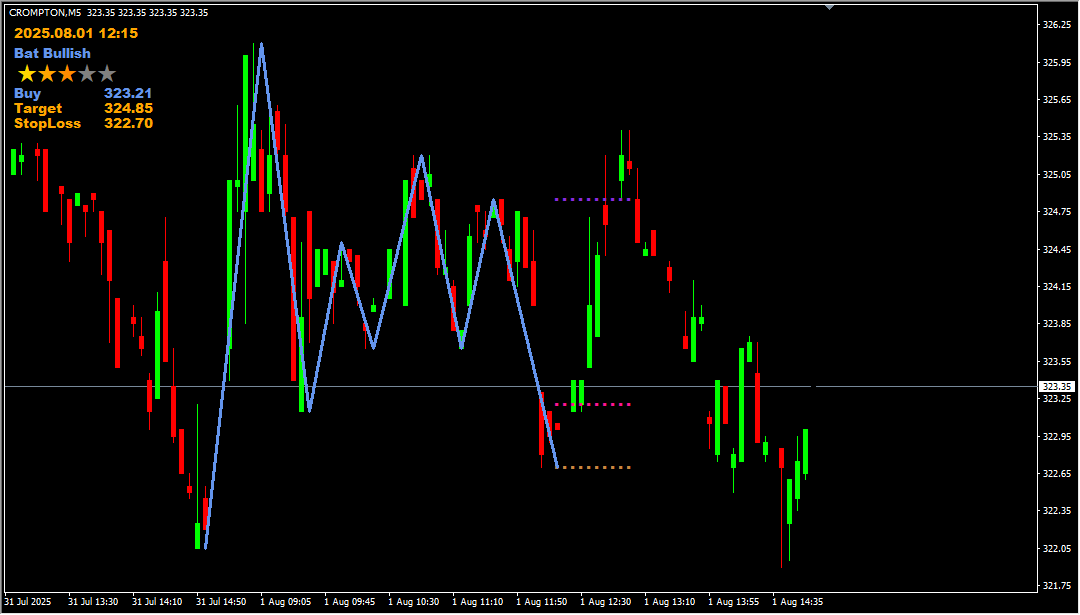
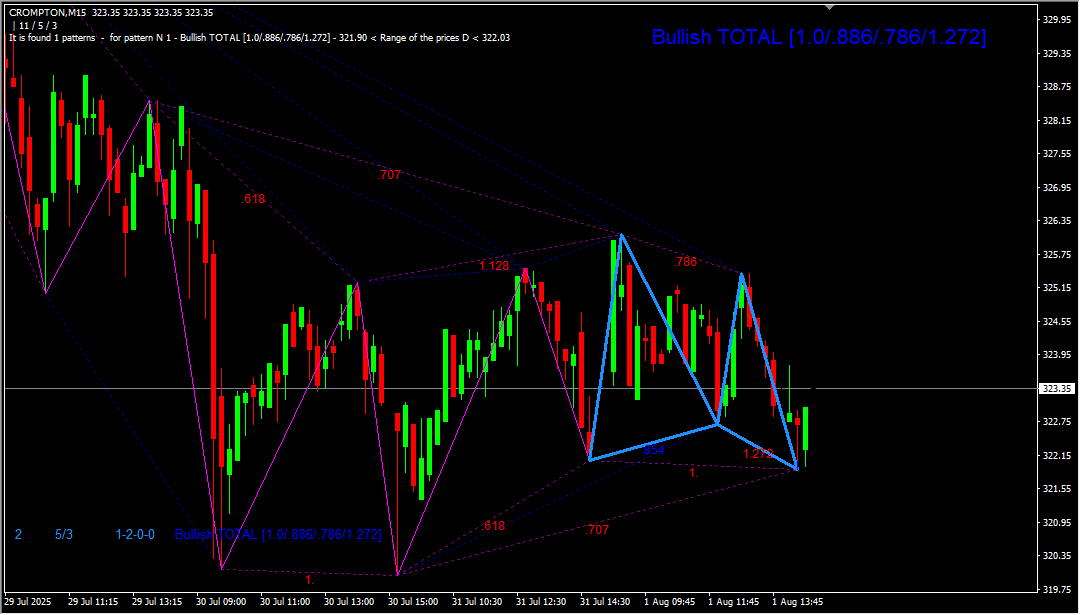
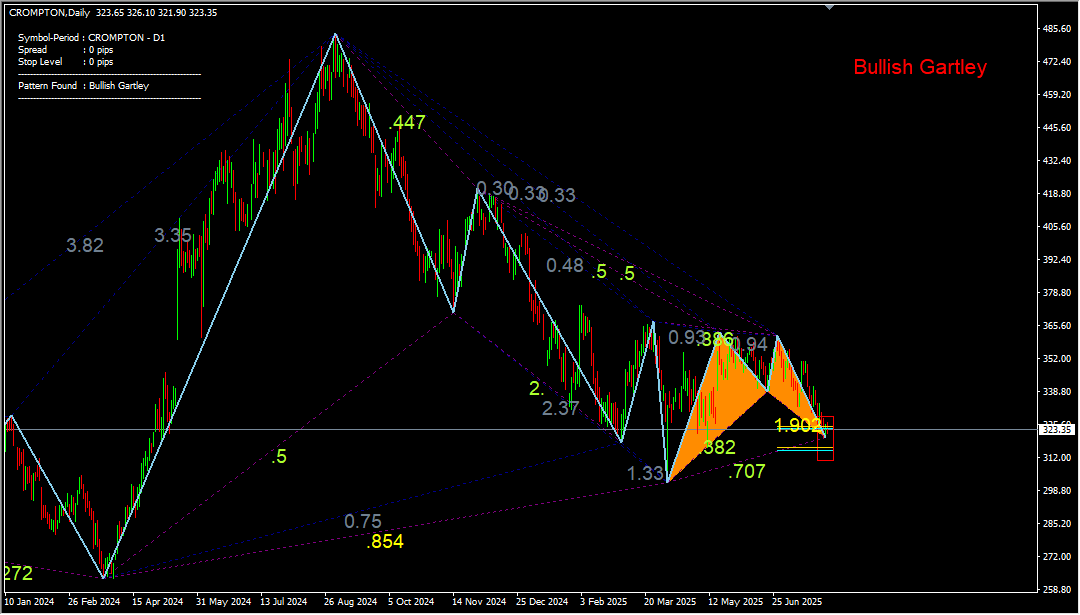
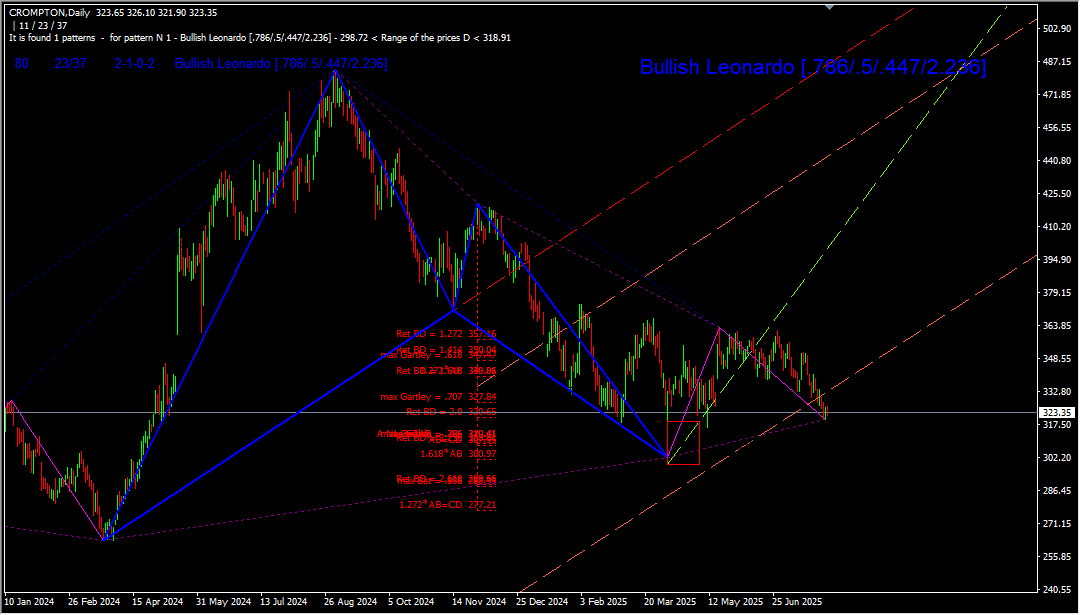
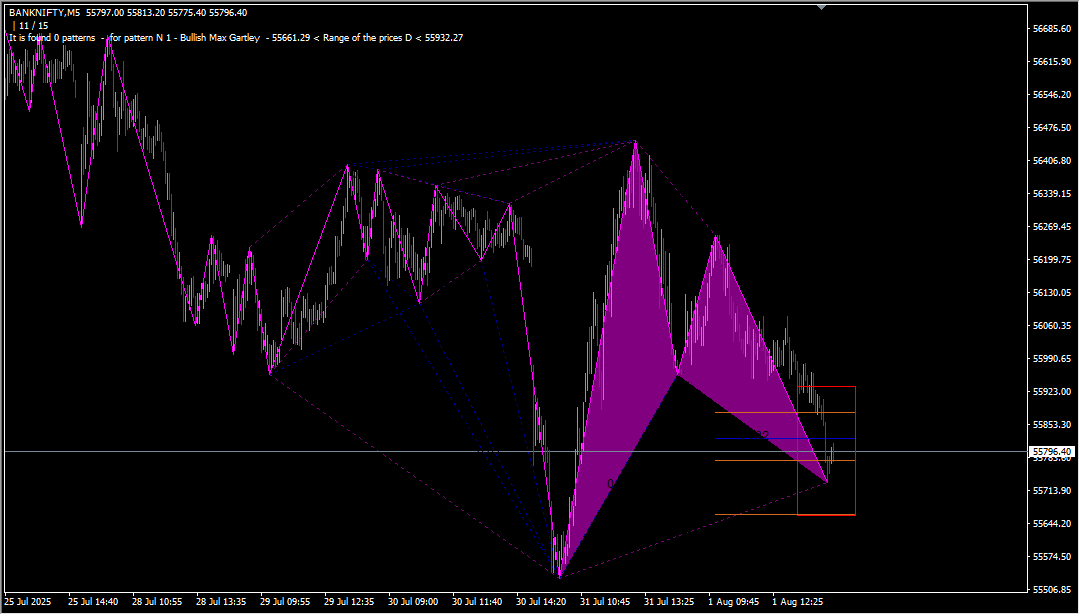
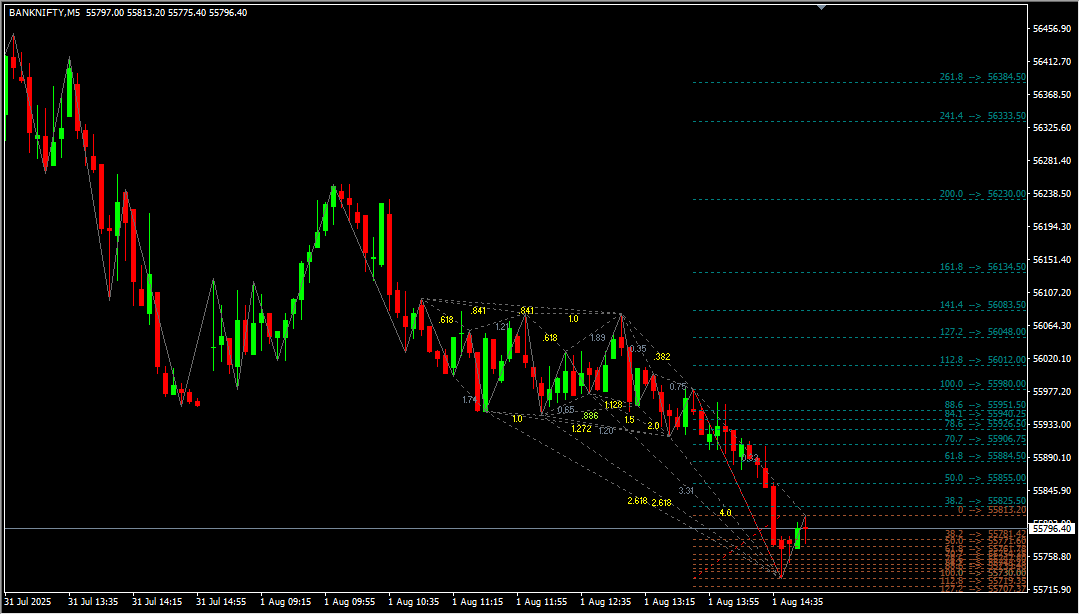
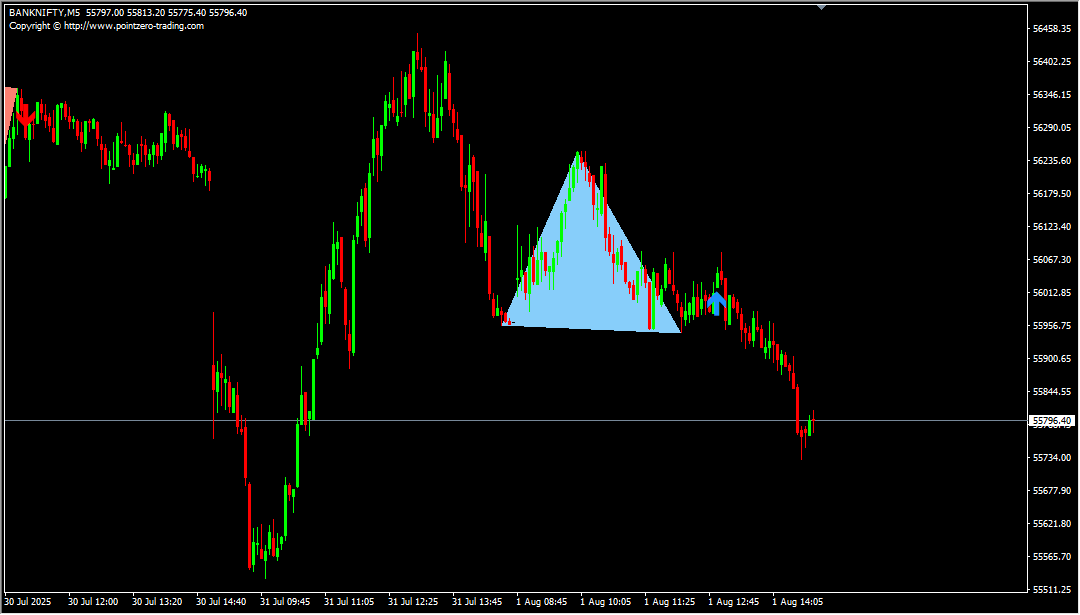
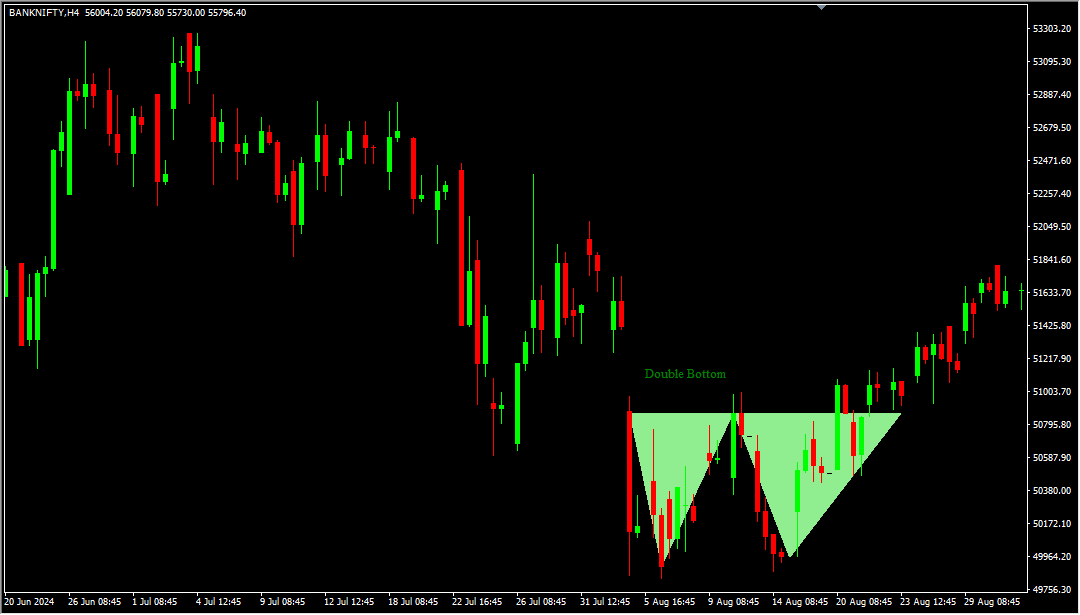
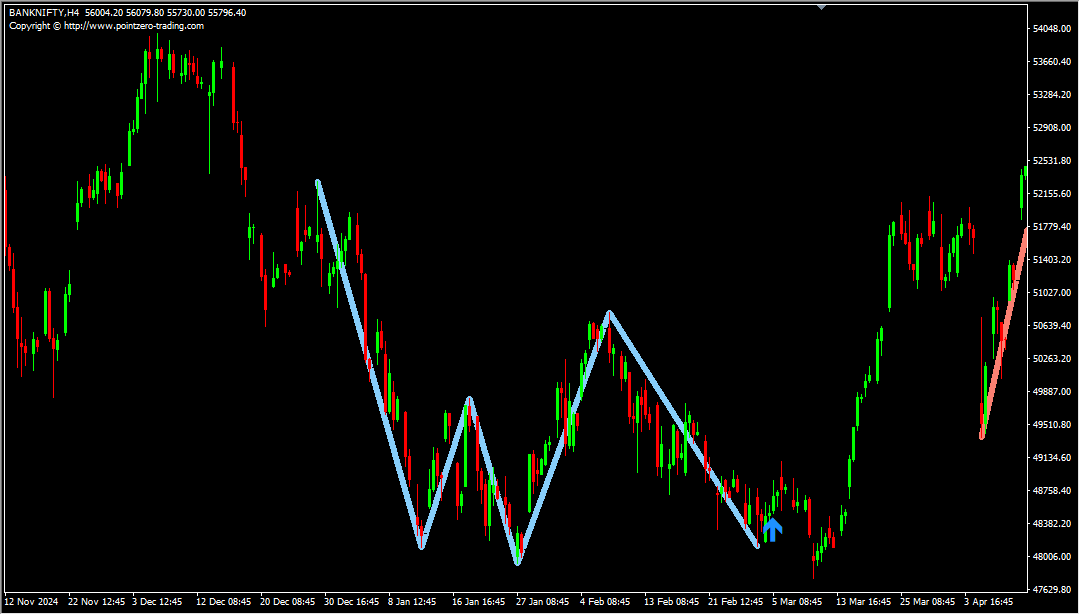
🔍 Instant Pattern Identification
As soon as a harmonic pattern is identified, the dashboard highlights it instantly—no delays, no guesswork. The visual interface clearly shows the pattern’s structure, name (like Gartley, Bat, or Butterfly), and position, allowing you to make informed decisions quickly. This real-time pattern detection gives you a competitive edge by capturing setups as they emerge.
📈 Versatile Compatibility Across Markets
The scanner is not limited to a single market. It supports a wide range of financial instruments, including:
- MCX (Multi Commodity Exchange)
- NSE (National Stock Exchange)
- Equity Options
- Forex (Foreign Exchange Market)
This makes it an ideal tool for traders and investors operating in multiple markets or diversifying their portfolios.
⏰ Effective Across All Timeframes
Whether you’re a scalper working with minute-by-minute data, a swing trader analyzing daily patterns, or a long-term investor looking at monthly charts, the scanner adapts to your strategy. It maintains accuracy and effectiveness across all timeframes, providing consistent support for your trading decisions.
🔔 Customizable Alerts for Every Signal
Never miss an important setup again. With fully customizable alerts, you can choose how you’re notified the moment a pattern is detected. Alerts can be delivered in the form of:
- On-screen pop-up notifications
- Audible sounds
- Instant email messages
- Push notifications to your mobile device
These options ensure that you stay updated no matter where you are or how you prefer to receive information.
➡️ Quick Access to Relevant Charts
With just one click, you can jump directly from the dashboard to the chart associated with any signal. This streamlined access helps you act swiftly, reducing the time spent navigating between tools and enhancing your responsiveness to market conditions.
🗂️ Flexible Sorting Options for Easy Navigation
Customize your dashboard view to suit your needs. You can sort the detected patterns and signals based on:
- Symbol or instrument name
- Timeframe of the chart
- Direction of the pattern (bullish or bearish)
- Age of the signal (how recently it was identified)
These flexible sorting options help you quickly zero in on the most relevant opportunities without getting overwhelmed.
Risk Disclaimer
- TrendCharts.in and its associated products, services, software, and tools do not provide any offer or solicitation to buy or sell securities, futures, forex, commodities, or derivatives.
- We are not SEBI Registered Investment Advisors or Research Analysts.
- All materials are strictly for educational, informational, and paper trading & help in analysis purposes only.
- We do not provide advice for Real Money Trade, tips, buy/sell recommendations, or investment strategies.
- TrendCharts is solely involved in the development, sell, resale, and distribution of financial market software, datafeeds, indicators, scanners, and tools.
- All our offerings are intended for testing strategies and educational evaluation only—not for real-money trading.
- Users may utilize the software and tools for paper trading or strategy evaluation only.
- If users apply our offerings to actual trading (knowingly or unknowingly), TrendCharts.in or its stakeholders bear no responsibility for any profit or loss.
- Any such use is at the user’s sole discretion and risk.
- We explicitly disclaim liability for any financial loss, trading loss, or damages resulting from:
- Use of our software, tools, or services.
- Decisions made based on any charts, indicators, AFLs, data, or analysis from our products.
- All market data and content provided are subject to delays, inaccuracies, or errors.
- Past performance (actual or hypothetical) is not indicative of future results.
- Hypothetical or backtested performance may not reflect the impact of actual market conditions.
- Trading and investing involve substantial financial risk and can result in loss of capital beyond the initial investment.
- Users must use individual discretion and independent judgment while interpreting signals, strategies, or chart setups.
- Automated signals or scanners are tools for evaluation—not trading instructions.
- TrendCharts content does not account for personal financial conditions, goals, or investment profile.
- Before making any financial decisions, consult with a licensed financial advisor or SEBI-registered professional.
- Do not rely solely on any information presented on our site for actual trades.
- Datafeeds and information may be delayed as per data vendor policies or exchange requirements.
- We do not guarantee the real-time accuracy, timeliness, or completeness of such data.
- No legal claim may be made against us or our data providers based on inaccuracies.
- Any user testimonials are individual opinions and may not represent the typical user experience.
- Hypothetical performance results involve inherent limitations and should not be relied upon for real-money decisions.
- All opinions, data, signals, and analyses shared on the website are subject to change without notice.
- TrendCharts reserves the right to modify tools, content, and services at its discretion.
- Our software or product names are for branding purposes only and do not imply any market prediction or financial guarantee.
- No claim is made regarding profitability from any software usage.
- All content—charts, indicators, tools, or data—is designed for testing, analysis, and learning.
- No real-money trading or investment recommendations are provided or supported.
⚠️ Final Note: Trading in financial markets is speculative and may not be suitable for all investors. TrendCharts.in provides various automatic signal setups for Paper Trading & help in Analysis, it is not a “black box” system to be used without careful evaluation. Users must apply their judgment in filtering automated setups, particularly in relation to broader market trends. All trading decisions are solely the responsibility of the individual trader. Trading and investing involve risks, and losses are inevitable, So Kindly use only risk capital and never invest money you cannot afford to lose.
✅ Always remember🧠 my 3R Rule💡: If the money💰 is yours then, risk⚖️, reward🏆 and regret😔 are solely yours. 🔥


Reviews
There are no reviews yet.