TrendCharts India

Sale!
, ,

Demand Supply Scanner

Original price was: ₹15,000.00.Current price is: ₹6,000.00.

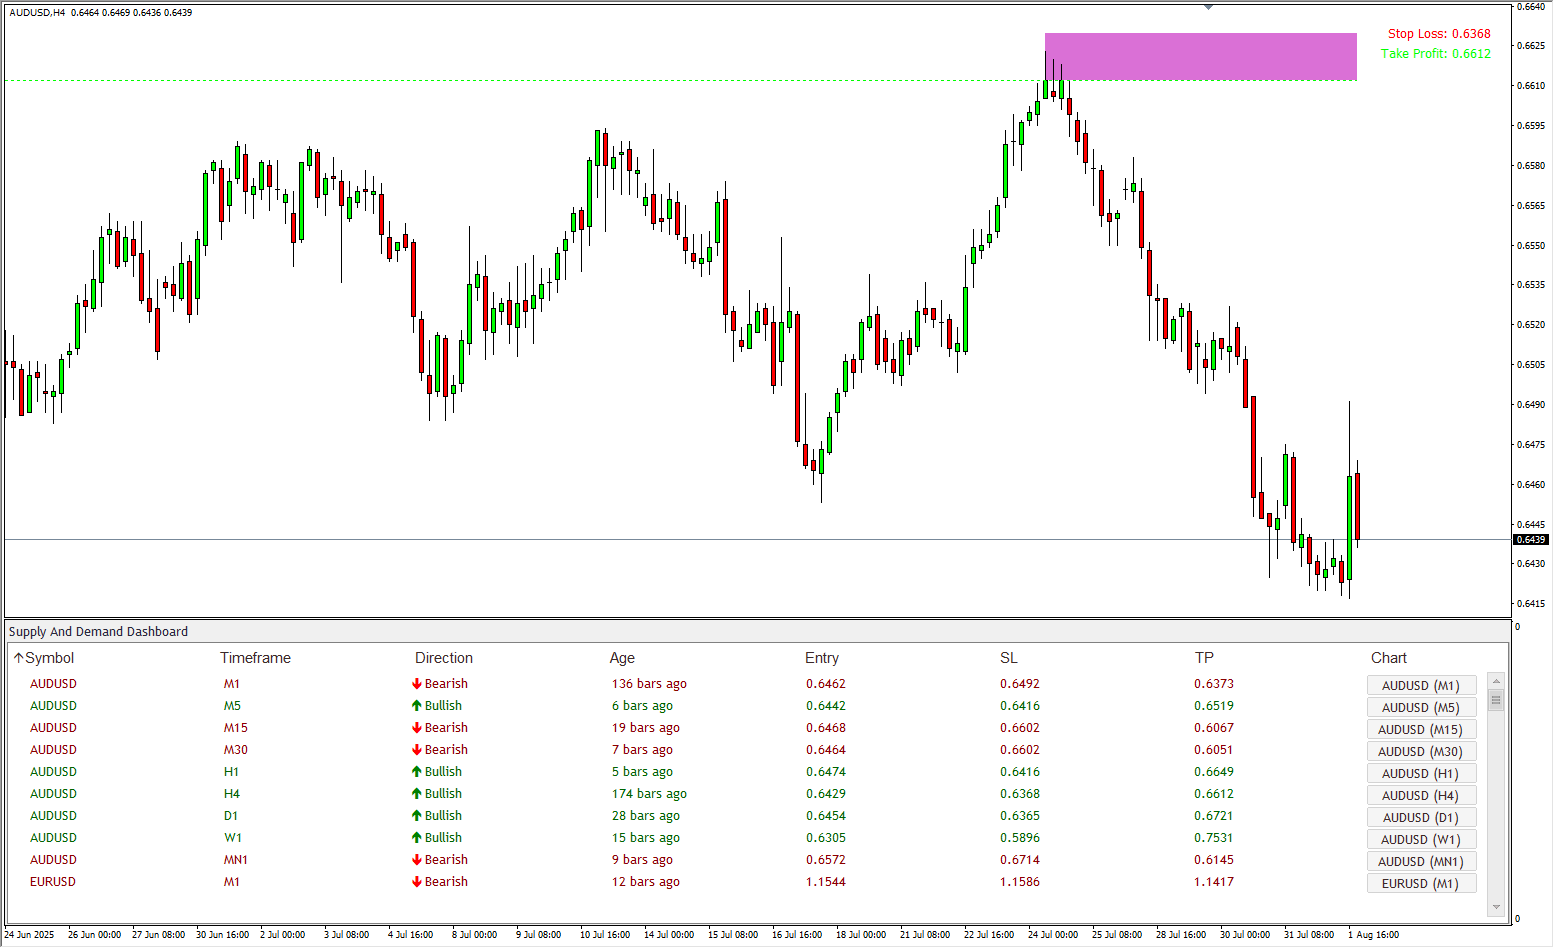
πŸ“Š Leads Price Action – Zones are detected before major moves happen.
πŸ”„ Perfect for Reversal Trading – Pinpoint turning points with ease.
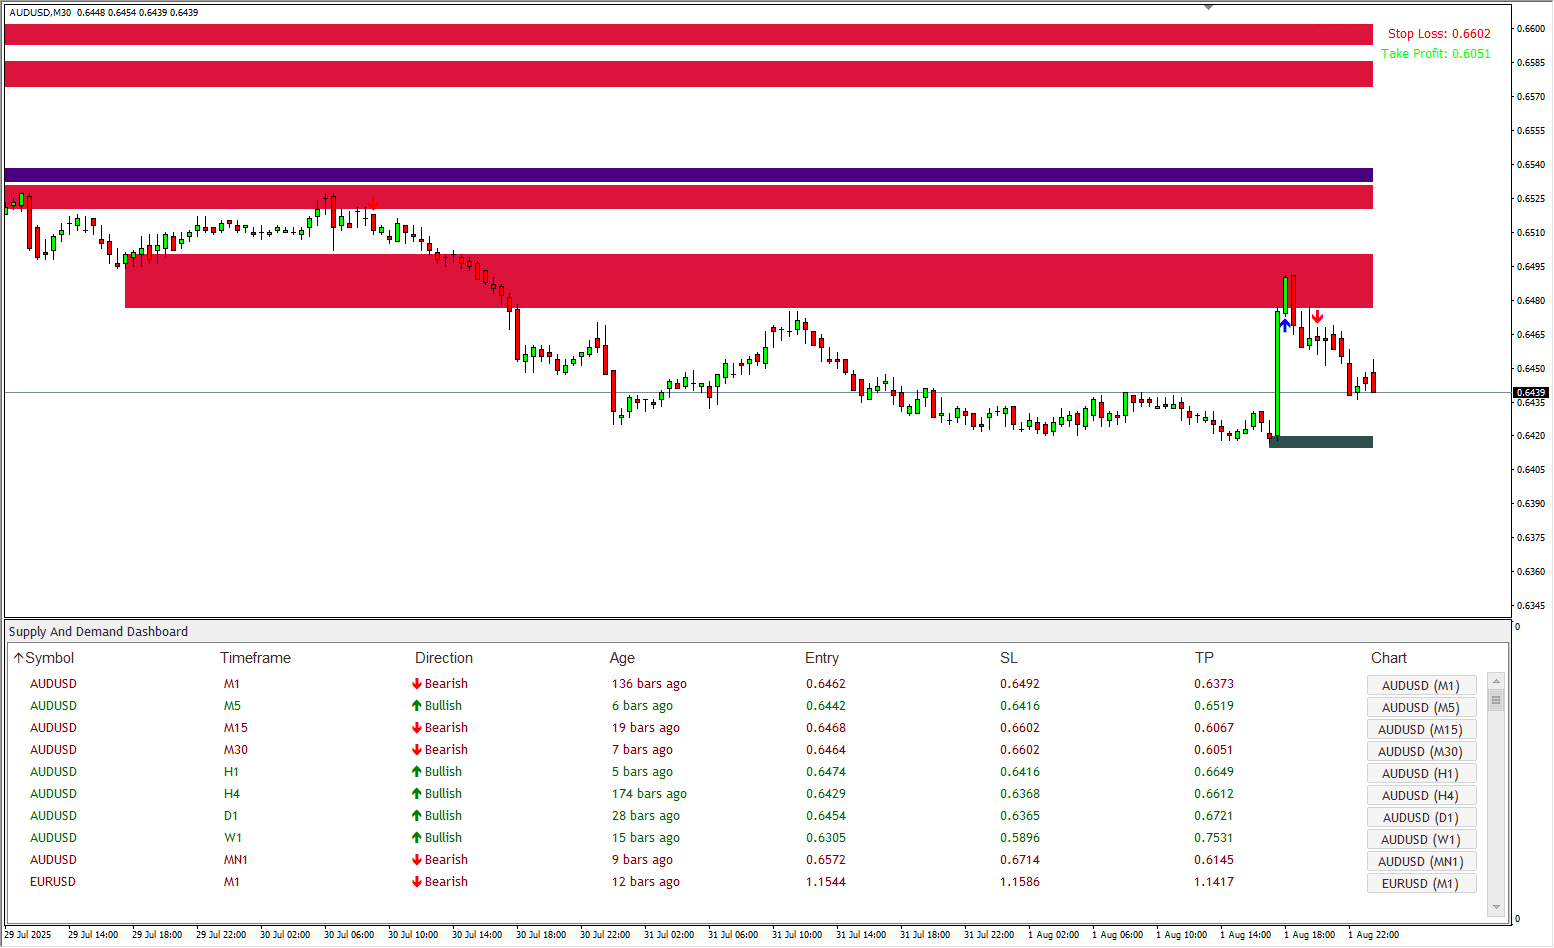
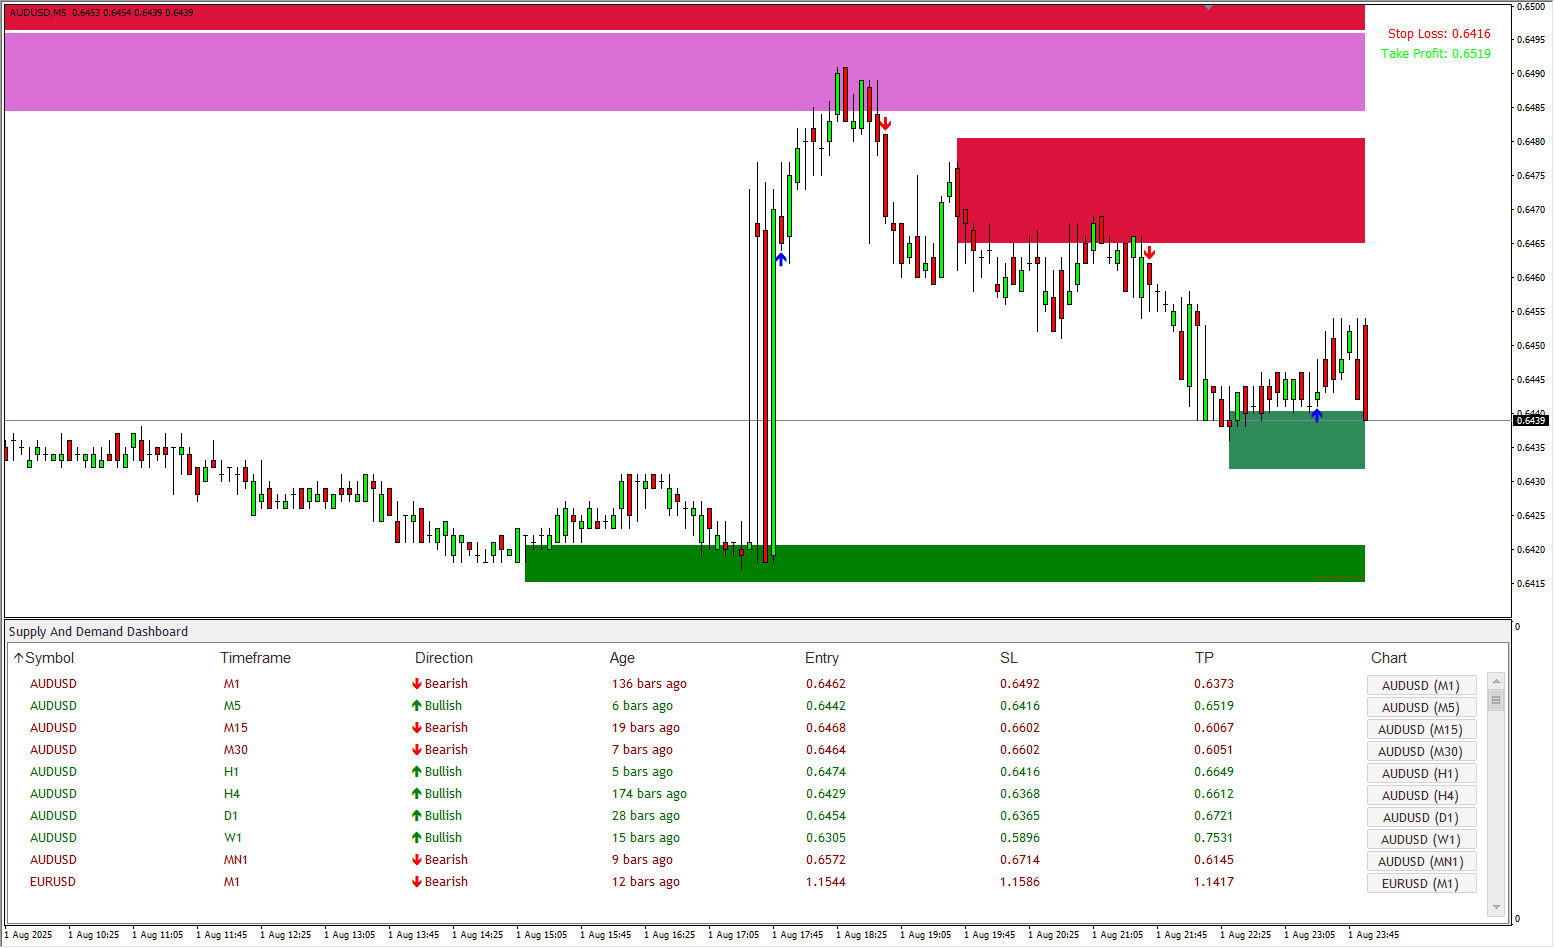
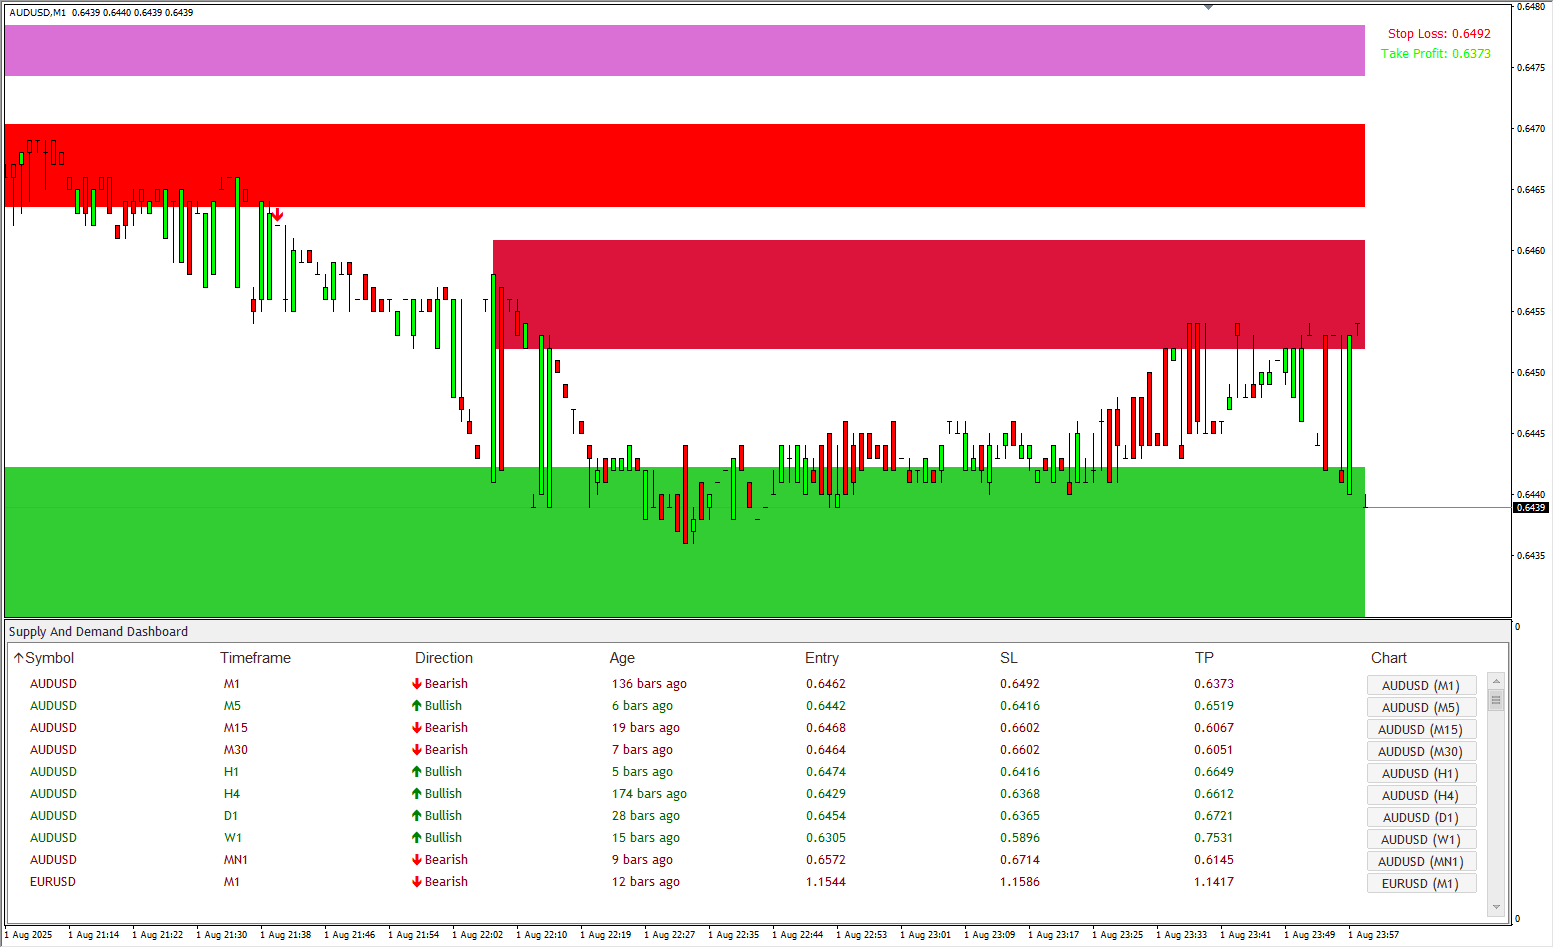
πŸ“ˆ Multi-Timeframe & Multi-Script Scanning – Full market coverage.
⚑ Instant Alerts – Pop-up, sound, email & push notifications.
πŸ’Ή Amazing Risk: Reward Ratio – Maximize profit potential.
πŸ“‰ No Manual Monitoring Needed – Let the scanner do the work
🧠 Strongest Zones in One View – Easy and actionable data.
🌐 Compatible with MCX, NSE, Forex & Options.
πŸ“† All Timeframes Supported – From 1 minute to 1 month.
πŸ–±οΈ One-Click Chart Access – Fast navigation from dashboard.
πŸ” Dashboard Sorting – Filter by Symbol, Timeframe, Direction, or Age.

πŸ” Core Functional Features

  • πŸ“Š Leads Price Action
    The scanner is designed to detect supply and demand zones ahead of price movement, giving you early entry opportunities before the market reacts. These pre-reversal zones often lead to significant trend changes, making it easier to catch trades early.
  • 🧲 Acts as Price Magnets
    Supply and demand zones act as natural gravitational forces in the market. Price is often pulled toward these areas before making a sharp move or reversal, giving traders a predictive edge in market behavior.
  • πŸ”„ Optimized for Reversal Trading
    Perfectly suited for traders who capitalize on pullbacks, rejections, and reversals, the scanner highlights zones that consistently lead to strong turning points in price β€” even in volatile conditions.

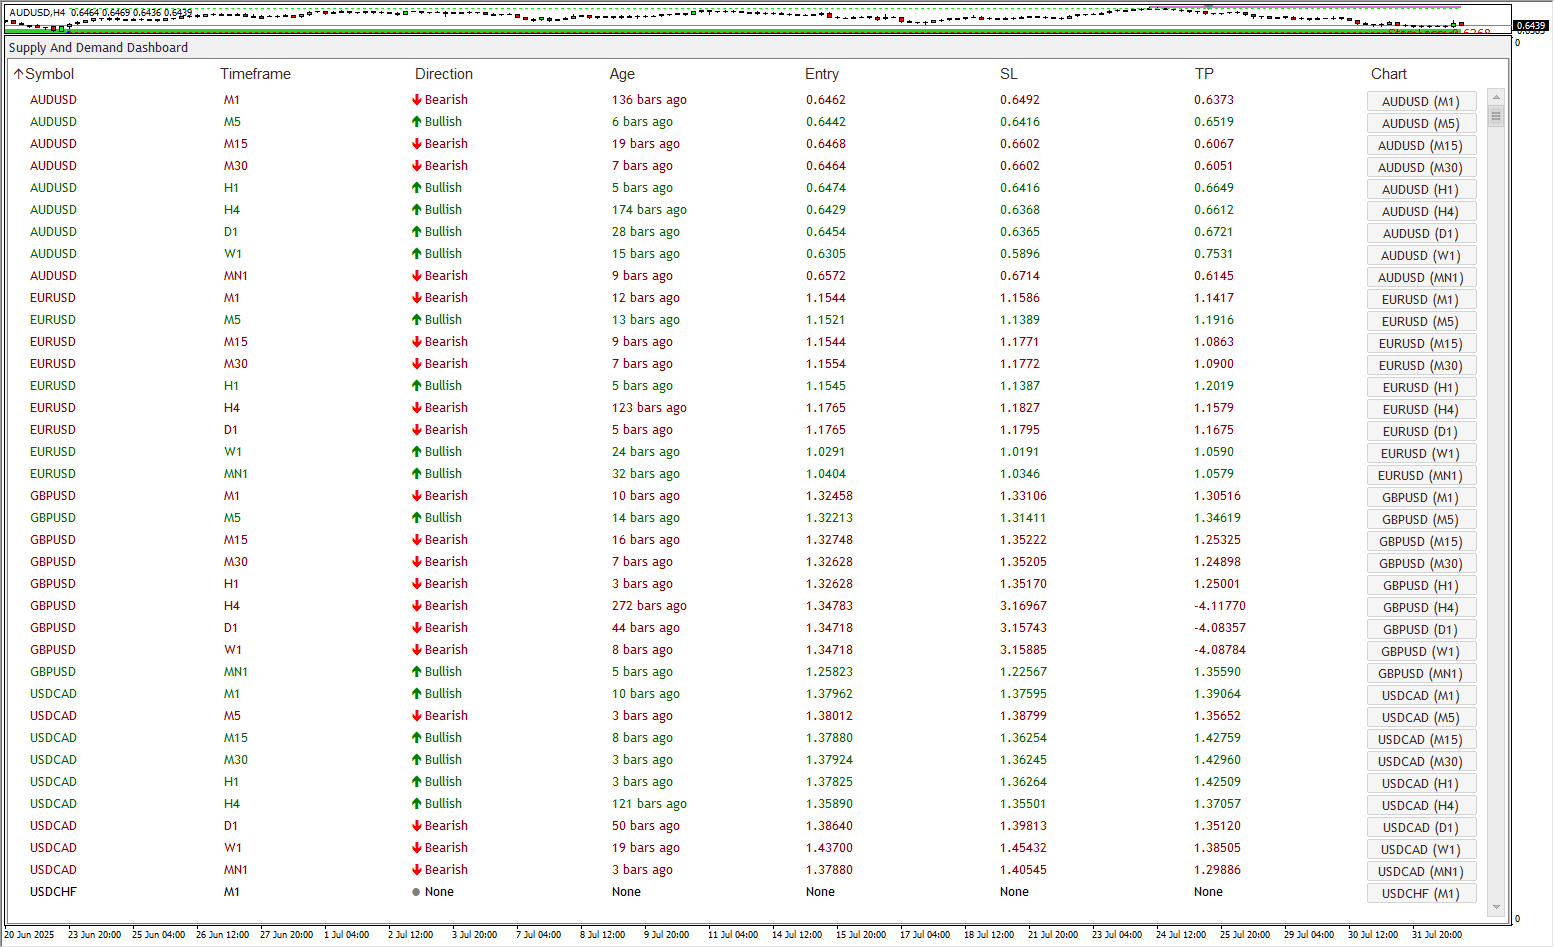
πŸ“ˆ All-in-One Smart Dashboard

  • πŸ–₯️ Multi-Script, Multi-Timeframe Scanning
    Scan hundreds of instruments across multiple timeframes simultaneously β€” from intraday scalping (1-minute) to positional trading (monthly). No need to manually switch charts or apply indicators individually.
  • 🧠 Strongest Zones Highlighted
    The scanner algorithm evaluates the strength of each zone based on volume, price reaction, and market structure, ensuring that only high-probability zones are shown.
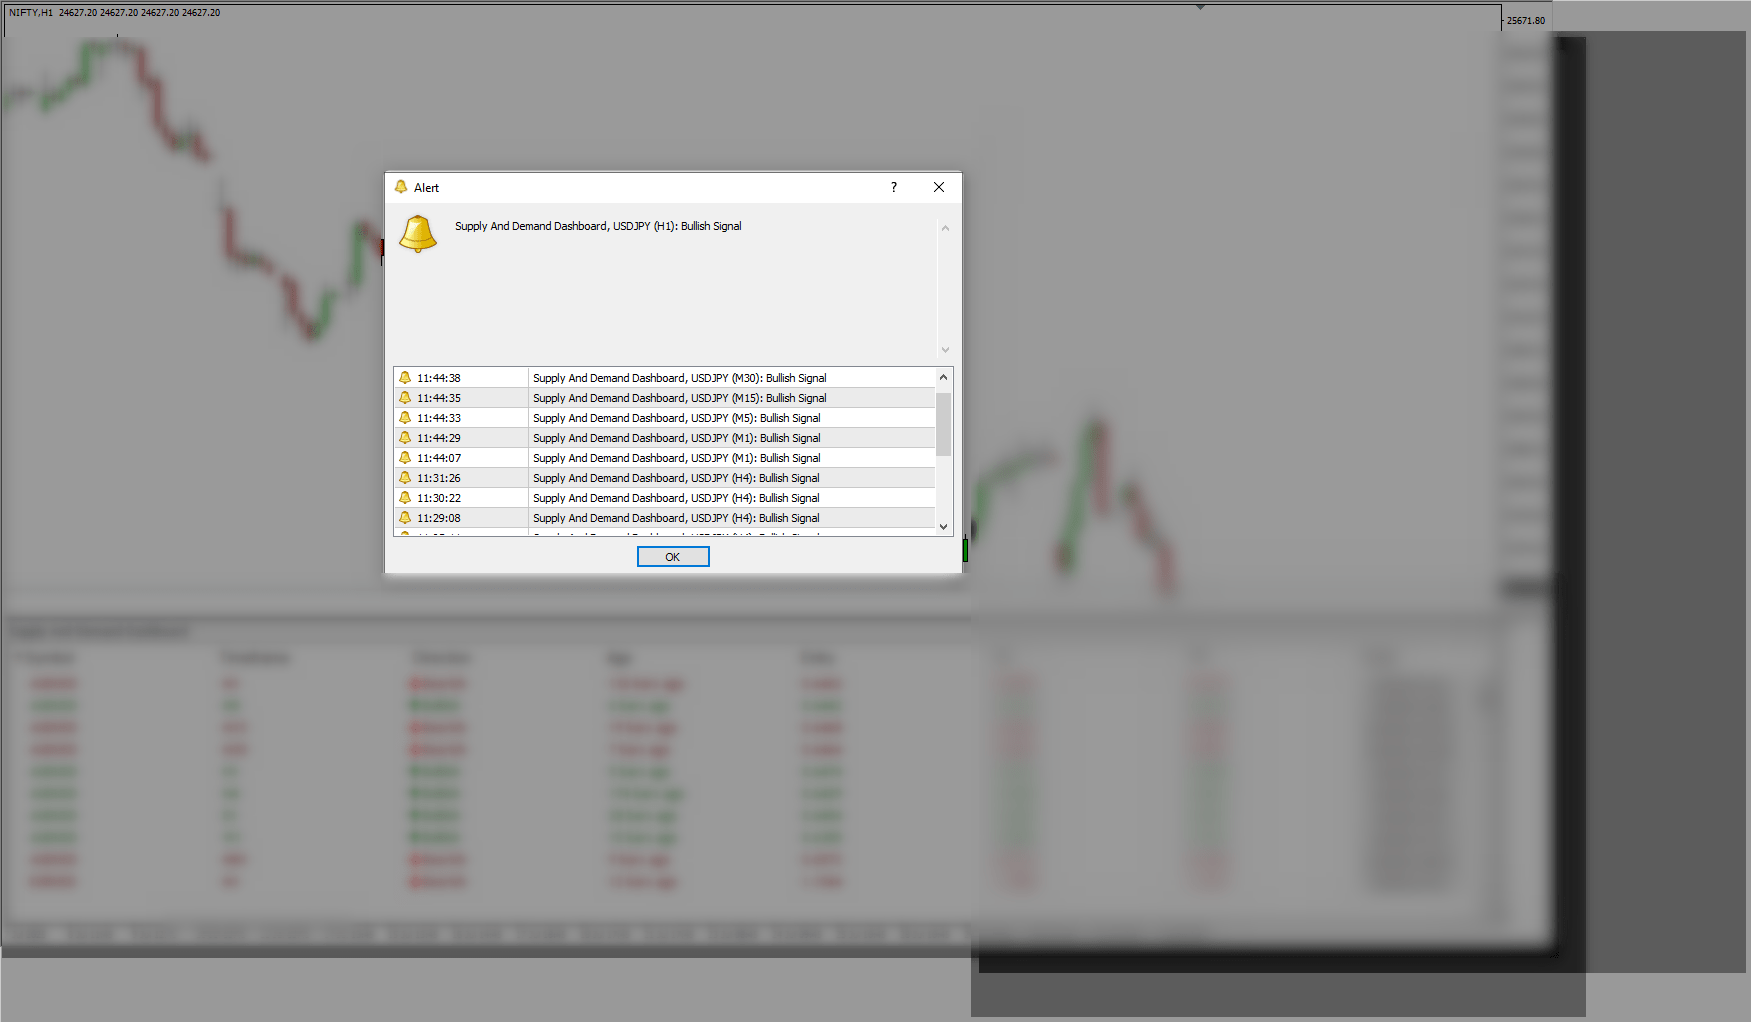
  • ⚑ Real-Time Alerts for New Zones
    Stay ahead of the curve with instant alerts the moment a new supply or demand zone is detected:
  • πŸ”” Pop-Up Alerts
  • πŸ”Š Sound Notifications
  • πŸ“§ Email Alerts
  • πŸ“± Push Notifications to Mobile
  • πŸ•ΉοΈ Dynamic Sorting & Filtering
    Customize your view and prioritize trades by sorting the dashboard based on:
  • πŸ“Œ Symbol (Ticker)
  • πŸ•’ Timeframe
  • πŸ“‰ Direction (Supply or Demand)
  • βŒ› Zone Age (Freshness)

🧩 Trader-Centric Design

  • πŸ–±οΈ One-Click Chart Access
    Instantly open the relevant chart directly from the dashboard with a single click. This ensures fast decision-making without jumping between platforms.
  • πŸ›‘οΈ Amazing Risk: Reward Opportunities
    The scanner is tailored to identify entries close to strong zones, providing tight stop-loss opportunities with a large reward potential, improving your overall trade expectancy.
  • πŸ“‰ Eliminates Manual Monitoring
    Forget flipping through countless charts. The scanner does all the technical groundwork and alerts you only when there’s something worth trading.

🌐 Compatibility & Flexibility

  • πŸ’Ή Supports All Major Markets
  • βœ… MCX (Crude Oil, Gold, Silver, etc.)
  • βœ… NSE Cash & Futures
  • βœ… Nifty & BankNifty Options
  • βœ… Forex Pairs
  • πŸ•’ Timeframe Flexibility
  • Use on any timeframe from 1-minute scalping to monthly investing. Perfect for intraday, swing, or positional traders.
  • πŸ”§ Minimal Setup, Maximum Efficiency
  • Designed for both beginners and professional traders. The interface is simple, the insights are deep, and the setup is plug-and-play.

πŸ’Ό Who Is This Scanner For?

  • πŸ“‰ Intraday Traders – Identify key levels to scalp high-probability reversals.
  • πŸ“ˆ Swing Traders – Plan precise entries near major zones with low risk.
  • πŸ§‘β€πŸ’Ό Professional Analysts – Use zone confirmation to support broader market views.
  • 🧠 Strategy Builders – Combine with your price action or indicator strategy for confluence.

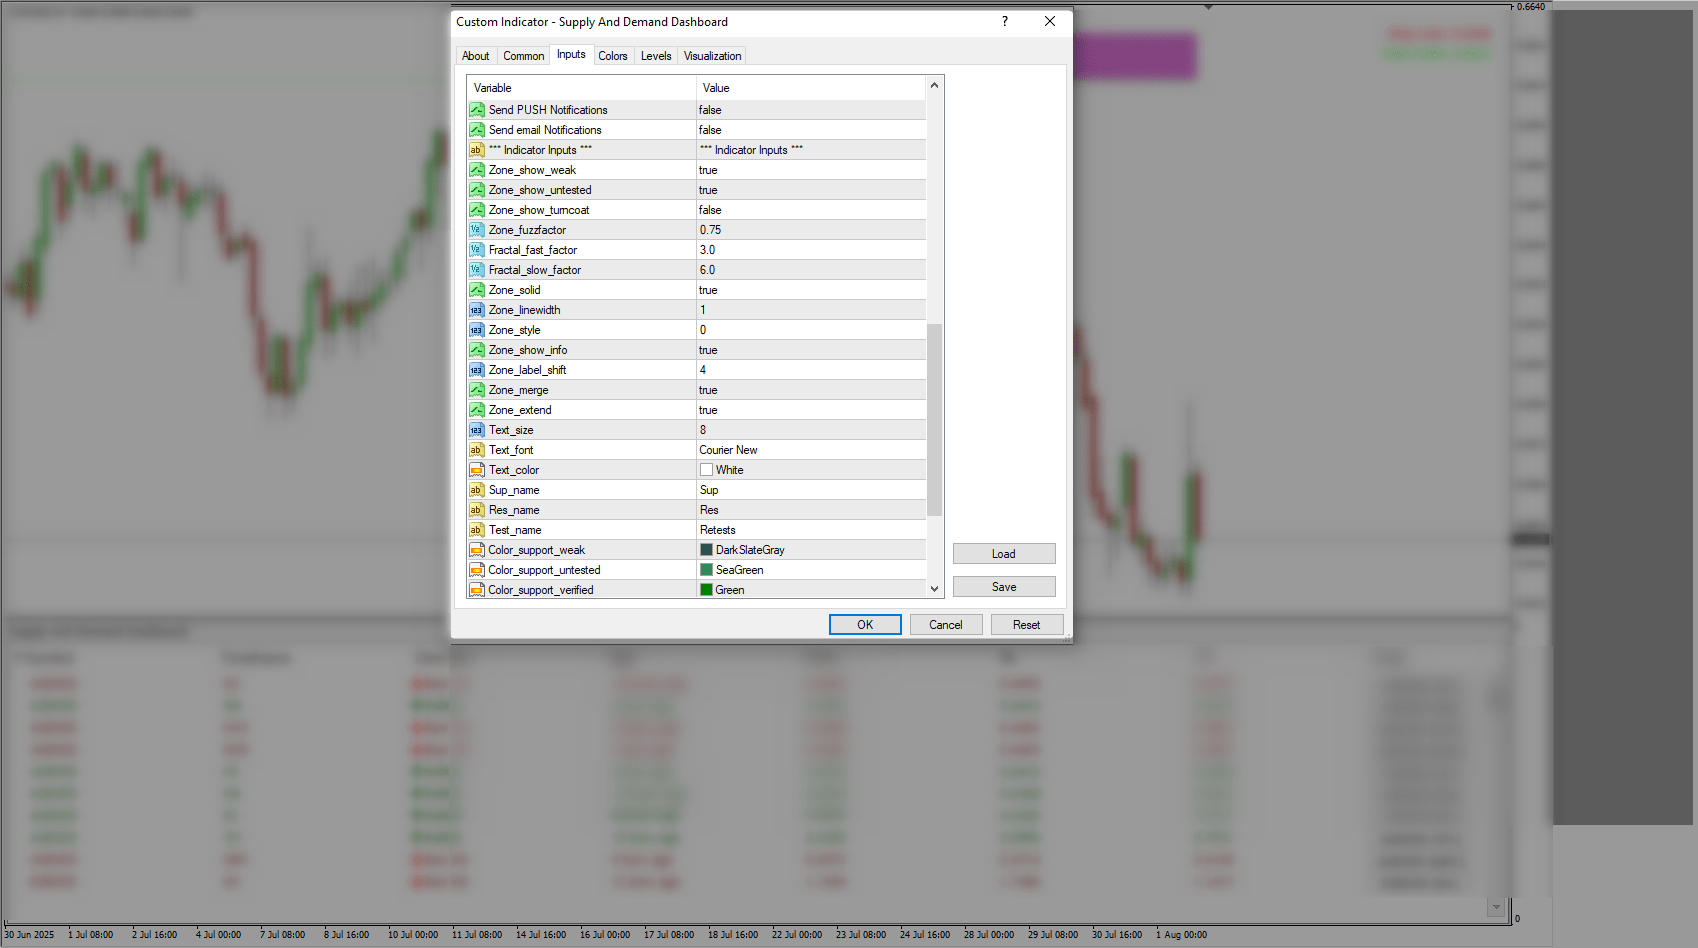
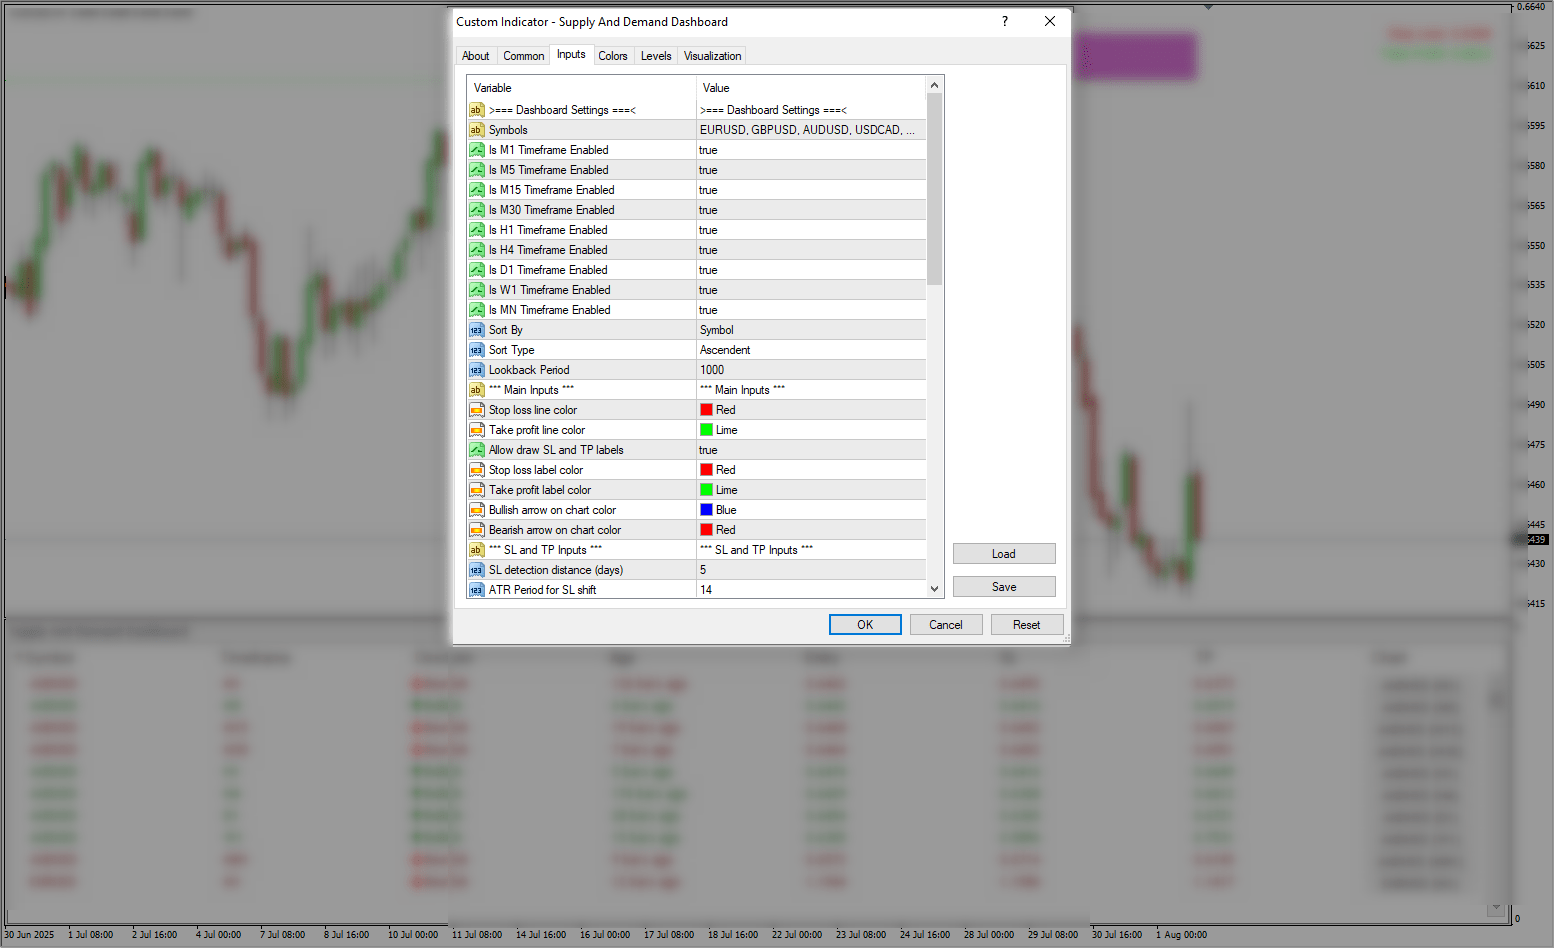
Input Settings and Controls

πŸ› οΈ Customization & Control Features

  • 🎯 Choose Stocks, Commodities & Currency Pairs
    Select exactly what you want to track β€” whether it’s NSE stocks, MCX commodities, or Forex pairs. Tailor your dashboard to suit your trading interests and market preferences.
  • ⏱️ Enable or Disable Timeframes as per Choice
    You can customize the scanner to include only the timeframes you trade β€” from scalping-friendly 1-minute charts to long-term monthly views. Eliminate clutter by turning off irrelevant timeframes.
  • πŸ“Š Sort Scripts Based on Multiple Filters
    Use advanced sorting options to organize your signals by:
  • πŸ”’ Symbol (Ticker Name)
  • ⏳ Timeframe (1M, 5M, 15M, 1H, etc.)
  • πŸ•°οΈ Age of Signal (Fresh, Mature, Expired)
  • πŸ” Direction (Supply or Demand)
  • 🧩 Pattern Type (Zone Type or Strength)
    This helps you quickly focus on high-priority opportunities.
  • βš™οΈ Easily Modify Scanner Parameters
    The scanner comes with fully editable input settings. You can adjust sensitivity, zone size, alert thresholds, and more β€” allowing full control over how the tool detects and displays zones.
  • πŸ”” Enable or Disable Alerts Anytime
    Turn alerts on or off based on your trading session or personal preference. Whether you want full notifications or a quiet screen, you stay in control.
  • 🎨 Customizable Indicator Colors
    Personalize the look and feel of your chart by changing zone colors, background themes, text highlights, and more. Match it with your trading template for a cleaner interface.

How to Use

Device Supported

Device Type Operating System Compatibility with TradingView
πŸ–₯️ Windows Laptop/Desktop Windows 8 / 8.1 / 10 / 11 βœ… Fully supported via browser and desktop app
🍏 MacBook / iMac macOS 10.15 or higher βœ… Fully supported via browser only

Risk Disclaimer

  • TrendCharts.in and its associated products, services, software, and tools do not provide any offer or solicitation to buy or sell securities, futures, forex, commodities, or derivatives.
  • We are not SEBI Registered Investment Advisors or Research Analysts.
  • All materials are strictly for educational, informational, and paper trading & help in analysis purposes only.
  • We do not provide advice for Real Money Trade, tips, buy/sell recommendations, or investment strategies.
  • TrendCharts is solely involved in the development, sell, resale, and distribution of financial market software, datafeeds, indicators, scanners, and tools.
  • All our offerings are intended for testing strategies and educational evaluation onlyβ€”not for real-money trading.
  • Users may utilize the software and tools for paper trading or strategy evaluation only.
  • If users apply our offerings to actual trading (knowingly or unknowingly), TrendCharts.in or its stakeholders bear no responsibility for any profit or loss.
  • Any such use is at the user’s sole discretion and risk.
  • We explicitly disclaim liability for any financial loss, trading loss, or damages resulting from:
  • Use of our software, tools, or services.
    Decisions made based on any charts, indicators, AFLs, data, or analysis from our products.
  • All market data and content provided are subject to delays, inaccuracies, or errors.
  • Past performance (actual or hypothetical) is not indicative of future results.
  • Hypothetical or backtested performance may not reflect the impact of actual market conditions.
  • Trading and investing involve substantial financial risk and can result in loss of capital beyond the initial investment.
  • Users must use individual discretion and independent judgment while interpreting signals, strategies, or chart setups.
  • Automated signals or scanners are tools for evaluationβ€”not trading instructions.
  • TrendCharts content does not account for personal financial conditions, goals, or investment profile.
  • Before making any financial decisions, consult with a licensed financial advisor or SEBI-registered professional.
  • Do not rely solely on any information presented on our site for actual trades.
  • Datafeeds and information may be delayed as per data vendor policies or exchange requirements.
  • We do not guarantee the real-time accuracy, timeliness, or completeness of such data.
  • No legal claim may be made against us or our data providers based on inaccuracies.
  • Any user testimonials are individual opinions and may not represent the typical user experience.
  • Hypothetical performance results involve inherent limitations and should not be relied upon for real-money decisions.
  • All opinions, data, signals, and analyses shared on the website are subject to change without notice.
  • TrendCharts reserves the right to modify tools, content, and services at its discretion.
  • Our software or product names are for branding purposes only and do not imply any market prediction or financial guarantee.
  • No claim is made regarding profitability from any software usage.
  • All contentβ€”charts, indicators, tools, or dataβ€”is designed for testing, analysis, and learning.
  • No real-money trading or investment recommendations are provided or supported.

⚠️ Final Note: Trading in financial markets is speculative and may not be suitable for all investors. TrendCharts.in provides various automatic signal setups for Paper Trading & help in Analysis, it is not a β€œblack box” system to be used without careful evaluation. Users must apply their judgment in filtering automated setups, particularly in relation to broader market trends. All trading decisions are solely the responsibility of the individual trader. Trading and investing involve risks, and losses are inevitable, So Kindly use only risk capital and never invest money you cannot afford to lose.

βœ… Always remember🧠 my 3R RuleπŸ’‘: If the moneyπŸ’° is yours then, riskβš–οΈ, rewardπŸ† and regretπŸ˜” are solely yours. πŸ”₯

Reviews

There are no reviews yet.

Be the first to review “Demand Supply Scanner”

Your email address will not be published. Required fields are marked *

UPI ID- trendcharts@kotak
Google Pay- 8860 575885
Phone Pay- 8860 575885
-------------------------------
A/C Transfer
BANK- KOTAK BANK
A/C NO.- 4850467174
IFSC CODE- KKBK0004661
NAME-ANKITA RAJPUT
UPI & BANK PAYMENTS
Pay & Send Screenshot on +91 8860 575885
Independence-Day-PNG-Picture

Independence Sale

Ends in
Days
Hours
Minutes
Seconds