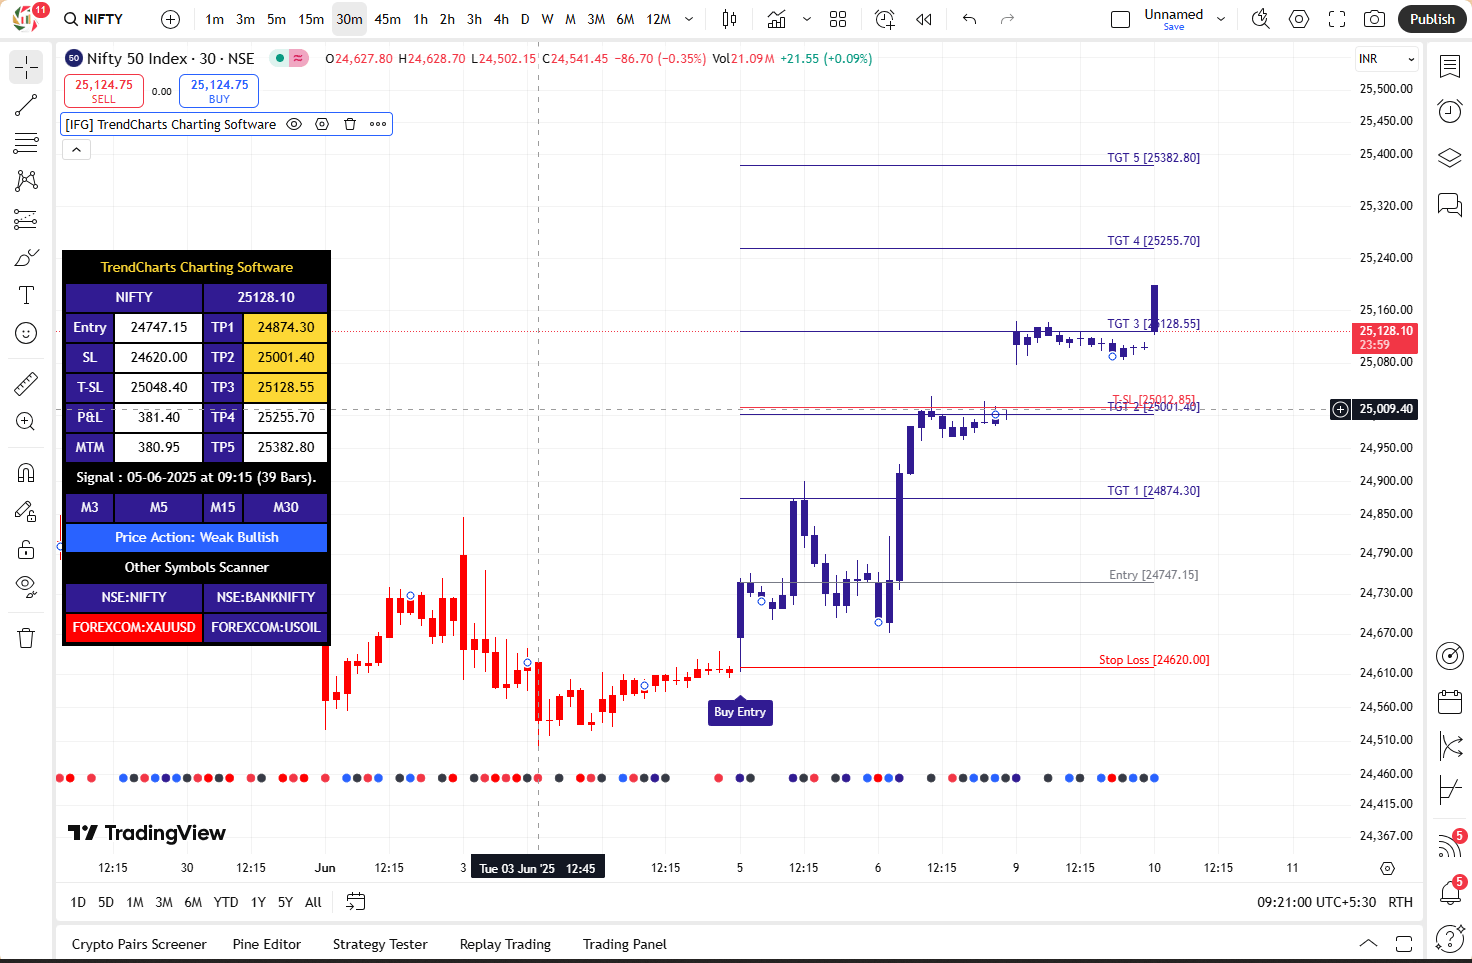
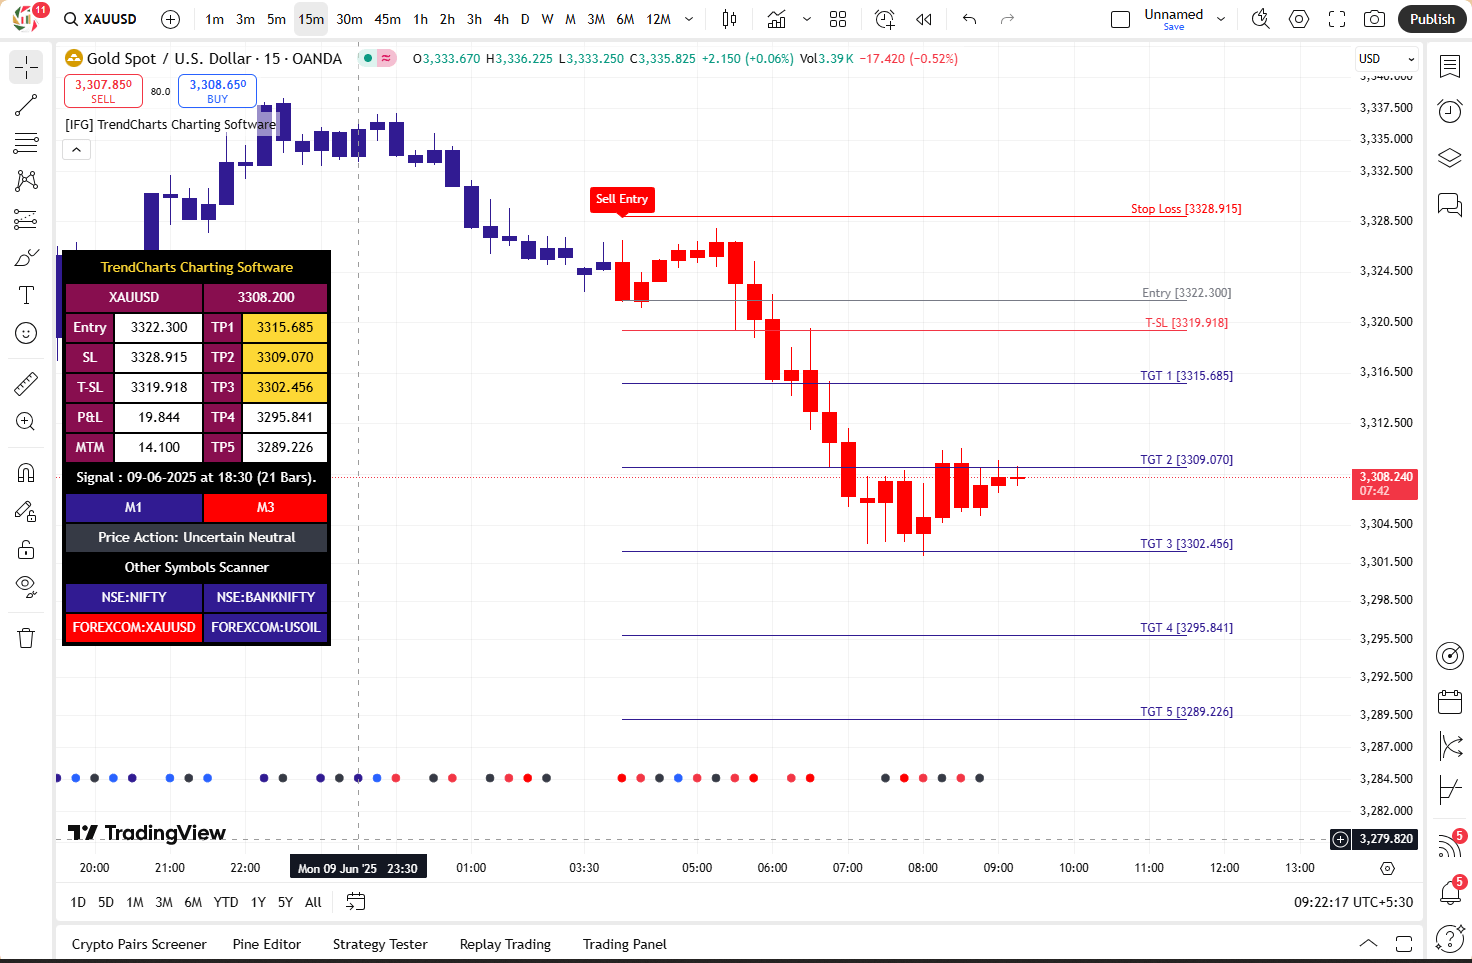
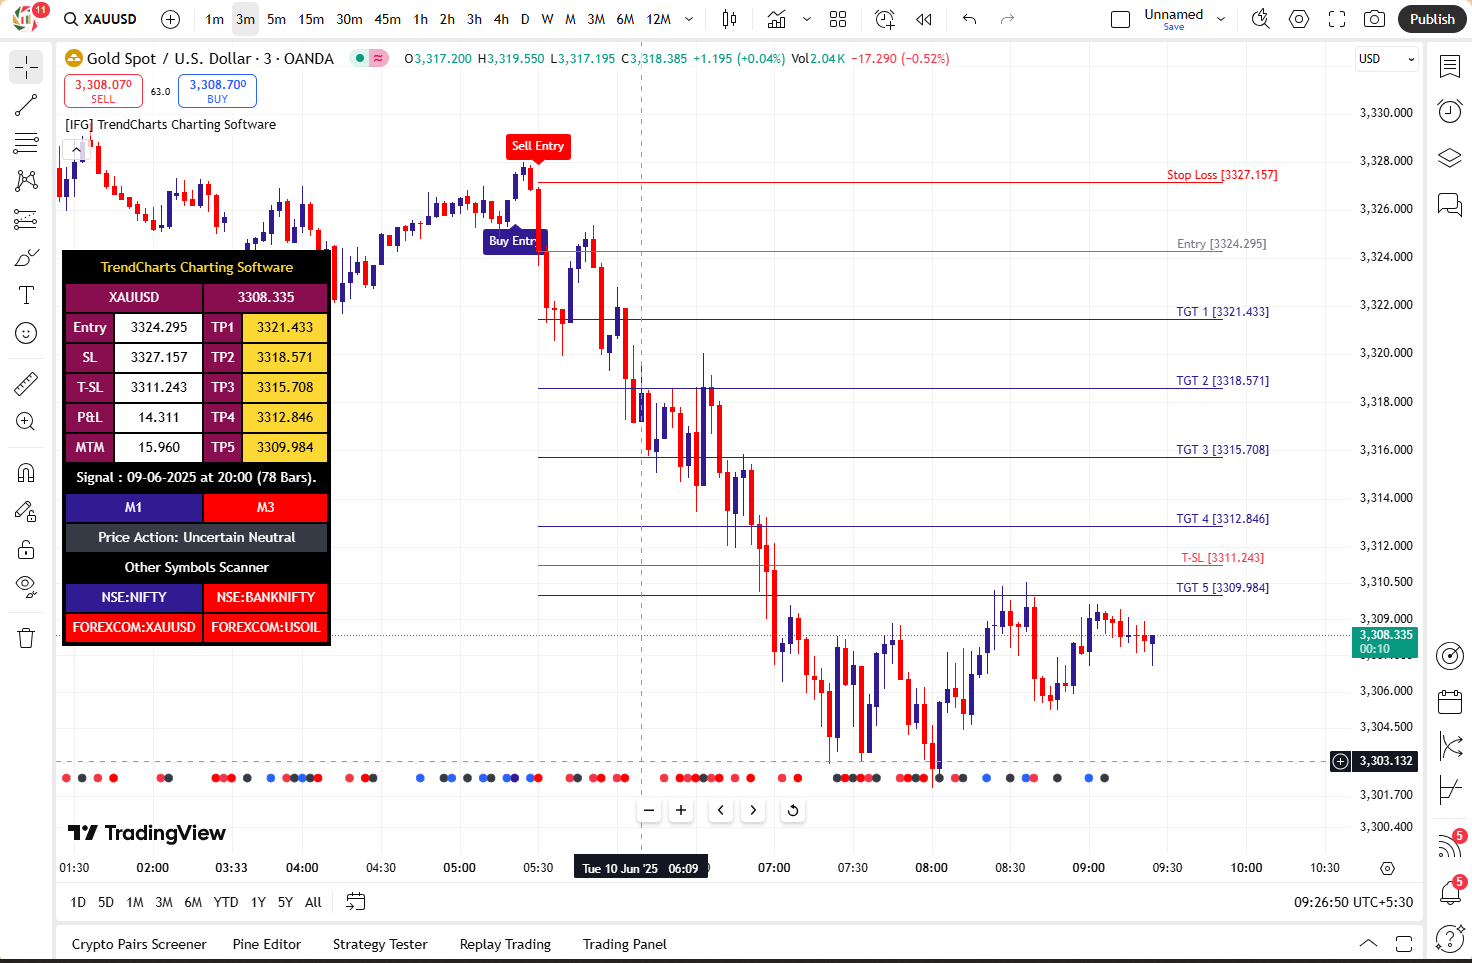
✅ Intelligent Entry Signals
Automatically detects high-probability Bullish/Bearish opportunities with predefined Risk for limited risk.
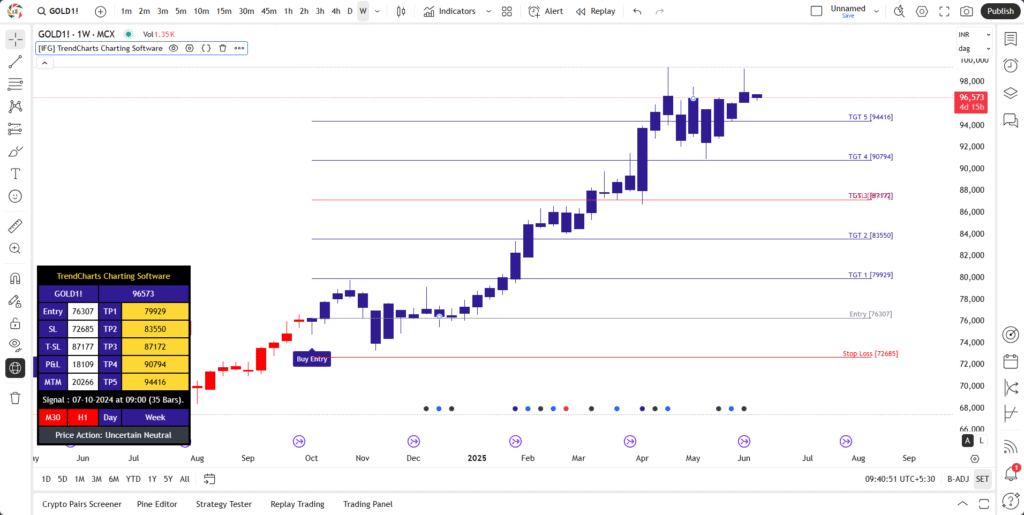
🎯 Dynamic Target Levels
Includes 5 precision targets: Level 1, Level 2, Level 3, Level 4, Level 5—tailored for various trading styles.
🛡️ Smart Risk Management
Built-in Trailing Risk adjusts automatically to help maximize profits and minimize losses.
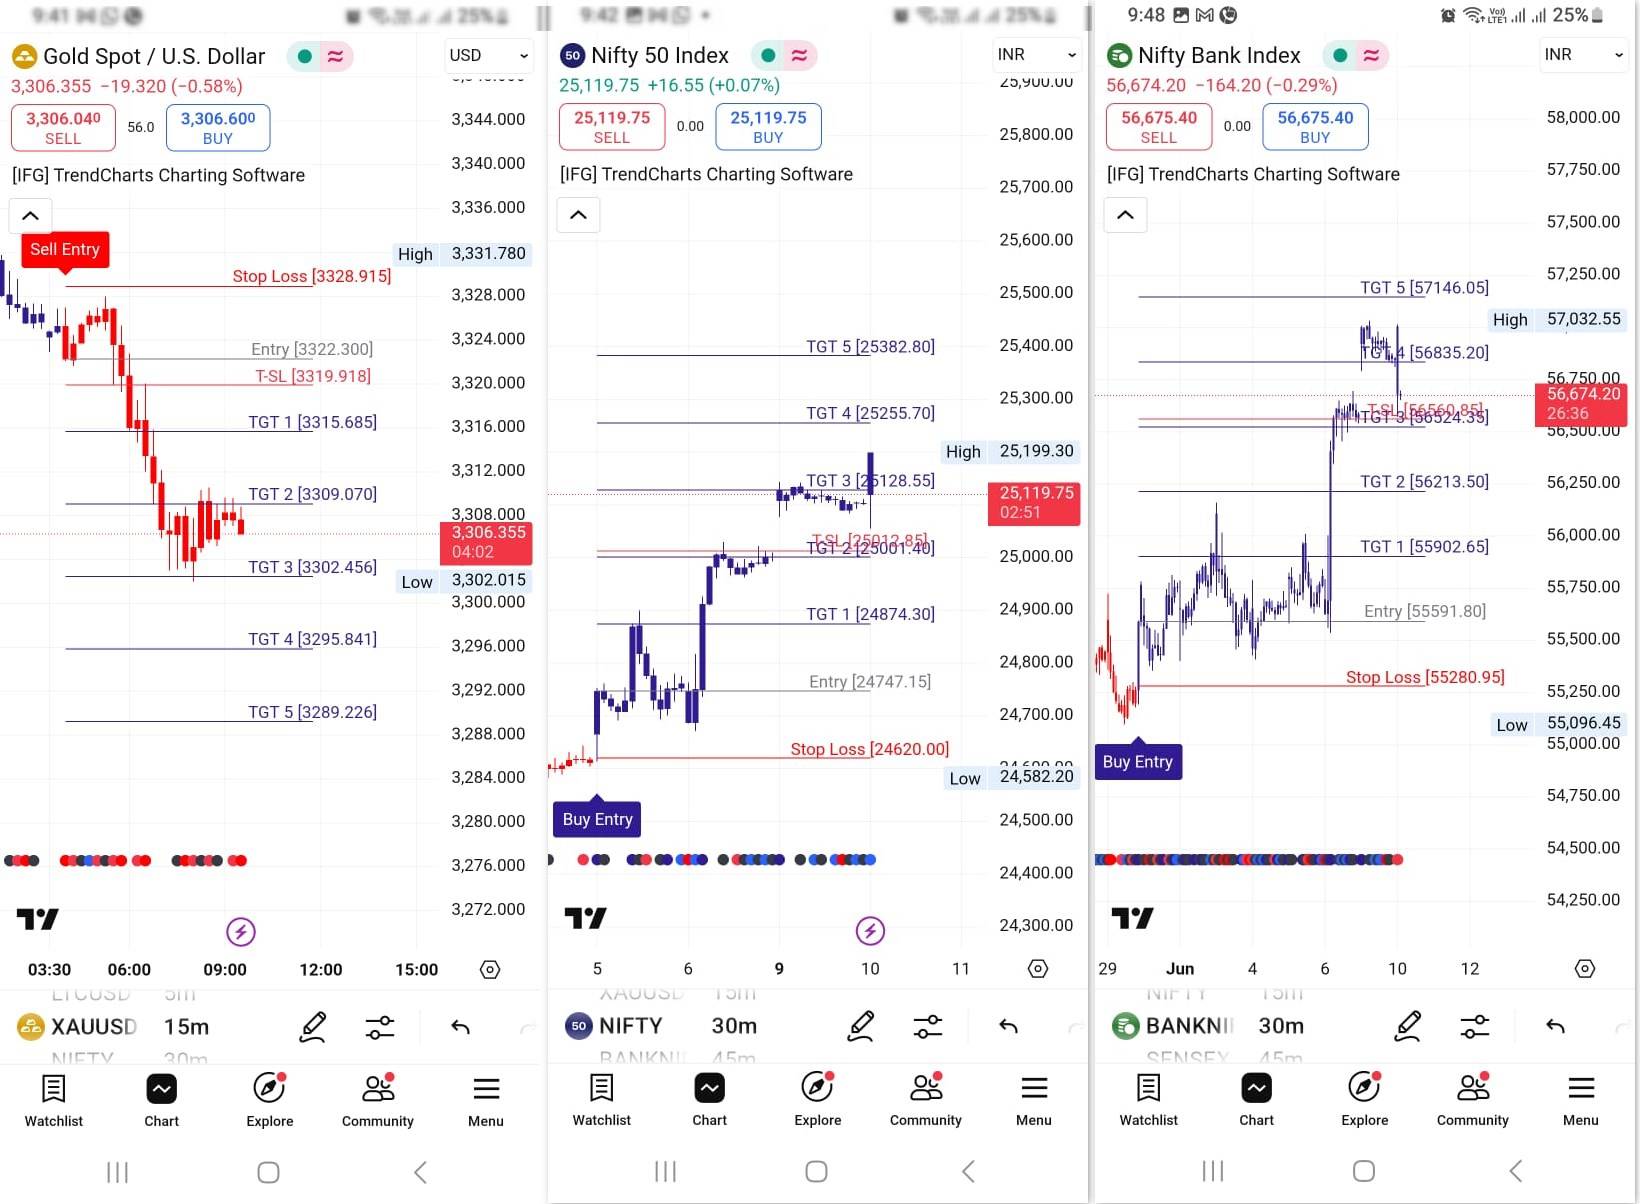
🧭 Multi-Time Frame Scanner
Get real-time signal tracking across multiple timeframes to confirm trade setups.
📊 Price Action Analysis
Visual insights into trend strength and direction—greatly improving decision-making accuracy.
📉 Real-Time Movement & P&L Dashboard
Monitor live price action and track your open position’s Profit & Loss directly on the chart.
🖥️ Dashboard Controls
✥ Adjust position and size on your chart
👁 Toggle display of trend levels, multi-timeframe scanners, and symbol scanners
🧩 View up to 4 additional symbols’ trend status in real time
🔔 Indicator Alerts (for paid TradingView users)
⚡ Entry Alerts (Enabled by default)
🎯 Levels Alerts (Optional)
🚩 Risk Alerts (Optional)
Stay informed with sound, popups, emails, and webhook notifications.
📶 Signal Type
🔥 Several Signals (Risky): Scalping Mode
✅ Few Signals (Safe): Intraday, Swing/Positional Mode
📊Candlestick Type
🔻 Signal Candlestick: Colors based on Buy/Sell Signals
🎚 Standard Candlestick: Colors based on traditional open/close data
🎯 Target Type
🧭 Small Levels: Short-range Levels and Risk
⛰ Big Levels: Longer-range Levels and Risk
How to Use
🛠️ TrendCharts Indicator on TradingView
Follow these steps to set up and trade using the TrendCharts indicator effectively on TradingView:
① Add the Indicator to Your Chart
👉🏿 Open TradingView and sign in to your account.
👉🏿 Select any symbol (NIFTY, BANKNIFTY, or stocks/futures).
👉🏿 Click on Indicators → Invite-Only Scripts.
👉🏿 Choose [IFGlobal] TrendCharts Charting Software
👉🏿 The indicator and dashboard will automatically load on your chart.
② Set Up the Parameters
Click the ⚙️ Settings icon on the indicator. Configure your preferred setup:
⚡ Signal Type: Risky (Scalping) or Safe (Swing).
📊 Candlestick Type: Signal-based or Standard.
🎯 Target Size: Small or Big Levels
👁 Dashboard Settings: Show/hide levels, symbol scanner, multi-timeframe scanner.
🔔 Alerts (Pro users only): Enable Entry, Levels, and Risk notifications.
③ Analyze the Dashboard
The dashboard displays:
⚡ Active Bullish & Bearish signal with target levels (Level 01 to 05)
💰 Live P&L of open position
🛡️ Stop Risk and Trailing Risk
🧮 Current trend on multiple timeframes
🧩 Additional symbol trends (up to 4)
④ Confirm Your Trade
Before entering any trade:
✅ Check that the signal matches the overall trend.
🧠 Confirm the alignment of multi-timeframe direction, price action, and signal color.
🖼 Once aligned → Enter the trend confidently.
⑤ Manage Your Position
🔄 As soon as Trailing Risk appears, update your Risk accordingly.
🧮 Monitor profit using the P&L section.
🔒 Exit manually at Levels or let Trailing Risk trail your gains automatically.
⏱️ Timeframe Recommendations
| Timeframe |
Strategy |
| M1–M3 |
Scalping |
| M3–M15 |
Intraday |
| M15–M30 |
BTST/STBT |
| H1–H4 |
Holding (5–10 days) |
| H2–Daily |
Holding (10–30 days) |
⚠️ Longer timeframes are not recommended for this strategy.
🔔 Notifications & Alerts
Receive alerts via:
💬 Popup / 🔊 Sound
📧 Email
🔗Webhook (API integration)
🛑 Note: Alert features are available only for TradingView Pro or higher plans.
Devices Supported
💻 1. Desktop / Laptop Computers
| Device Type |
Operating System |
Compatibility with TradingView |
| Windows Laptop/Desktop |
Windows 8 / 8.1 / 10 / 11 |
✅ Fully supported via browser and app |
| MacBook / iMac |
macOS 10.15+ |
✅ Fully supported via browser |
| Linux PC / Laptop |
Ubuntu / Debian / Fedora / Others |
✅ Supported via browser |
📱 2. Smartphones / Mobile Devices
| Device Type |
Operating System |
Compatibility with TradingView |
| Android Phone |
Android 8.0+ |
✅ Native TradingView App + Web |
| iPhone (All Models) |
iOS 14+ |
✅ Native TradingView App + Web |
| Huawei Devices (No Google Services) |
HarmonyOS |
⚠️ Web access only (App may not work fully) |
📟 3. Tablets
| Device Type |
Operating System |
Compatibility with TradingView |
| Android Tablets |
Android 8.0+ |
✅ Native App + Web Browser |
| iPad / iPad Pro |
iPadOS 14+ |
✅ Full TradingView App + Safari support |
| Windows Tablets |
Windows 8/10/11 |
✅ Use browser (Edge/Chrome) or install Windows app |
📺 4. Other / Limited Support Devices
| Device Type |
OS / Platform |
Compatibility with TradingView |
| Smart TV (Android TV) |
Android TV |
⚠️ Web access only (basic view) |
| Smart TV (WebOS, Tizen) |
LG / Samsung OS |
⚠️ Limited web access only |
| Chromebook |
ChromeOS |
✅ Use Chrome browser |
| Amazon Fire Tablets |
FireOS |
⚠️ Limited browser access |
| Raspberry Pi |
Linux (Debian) |
✅ Use Chromium/Firefox |
Risk Disclaimer
- TrendCharts.in and its associated products, services, software, and tools do not provide any offer or solicitation to buy or sell securities, futures, forex, commodities, or derivatives.
- We are not SEBI Registered Investment Advisors or Research Analysts.
- All materials are strictly for educational, informational, and paper trading & help in analysis purposes only.
- We do not provide advice for Real Money Trade, tips, buy/sell recommendations, or investment strategies.
- TrendCharts is solely involved in the development, sell, resale, and distribution of financial market software, datafeeds, indicators, scanners, and tools.
- All our offerings are intended for testing strategies and educational evaluation only—not for real-money trading.
- Users may utilize the software and tools for paper trading or strategy evaluation only.
- If users apply our offerings to actual trading (knowingly or unknowingly), TrendCharts.in or its stakeholders bear no responsibility for any profit or loss.
- Any such use is at the user’s sole discretion and risk.
- We explicitly disclaim liability for any financial loss, trading loss, or damages resulting from:
- Use of our software, tools, or services.
- Decisions made based on any charts, indicators, AFLs, data, or analysis from our products.
- All market data and content provided are subject to delays, inaccuracies, or errors.
- Past performance (actual or hypothetical) is not indicative of future results.
- Hypothetical or backtested performance may not reflect the impact of actual market conditions.
- Trading and investing involve substantial financial risk and can result in loss of capital beyond the initial investment.
- Users must use individual discretion and independent judgment while interpreting signals, strategies, or chart setups.
- Automated signals or scanners are tools for evaluation—not trading instructions.
- TrendCharts content does not account for personal financial conditions, goals, or investment profile.
- Before making any financial decisions, consult with a licensed financial advisor or SEBI-registered professional.
- Do not rely solely on any information presented on our site for actual trades.
- Datafeeds and information may be delayed as per data vendor policies or exchange requirements.
- We do not guarantee the real-time accuracy, timeliness, or completeness of such data.
- No legal claim may be made against us or our data providers based on inaccuracies.
- Any user testimonials are individual opinions and may not represent the typical user experience.
- Hypothetical performance results involve inherent limitations and should not be relied upon for real-money decisions.
- All opinions, data, signals, and analyses shared on the website are subject to change without notice.
- TrendCharts reserves the right to modify tools, content, and services at its discretion.
- Our software or product names are for branding purposes only and do not imply any market prediction or financial guarantee.
- No claim is made regarding profitability from any software usage.
- All content—charts, indicators, tools, or data—is designed for testing, analysis, and learning.
- No real-money trading or investment recommendations are provided or supported.
⚠️ Final Note: Trading in financial markets is speculative and may not be suitable for all investors. TrendCharts.in provides various automatic signal setups for Paper Trading & help in Analysis, it is not a “black box” system to be used without careful evaluation. Users must apply their judgment in filtering automated setups, particularly in relation to broader market trends. All trading decisions are solely the responsibility of the individual trader. Trading and investing involve risks, and losses are inevitable, So Kindly use only risk capital and never invest money you cannot afford to lose.
✅ Always remember🧠 my 3R Rule💡: If the money💰 is yours then, risk⚖️, reward🏆 and regret😔 are solely yours. 🔥


Reviews
There are no reviews yet.