Scanner Features
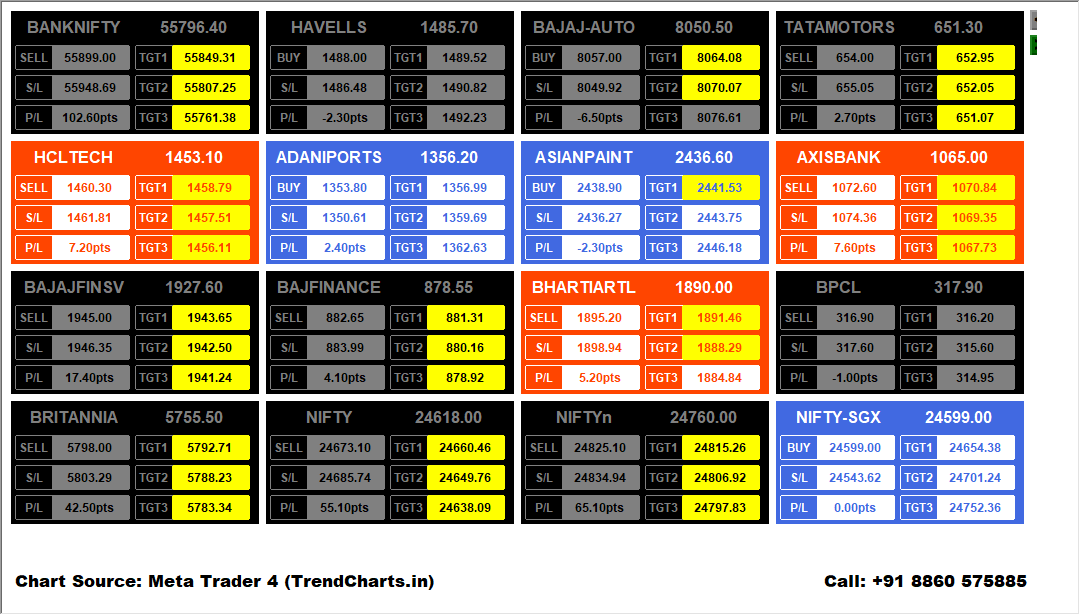
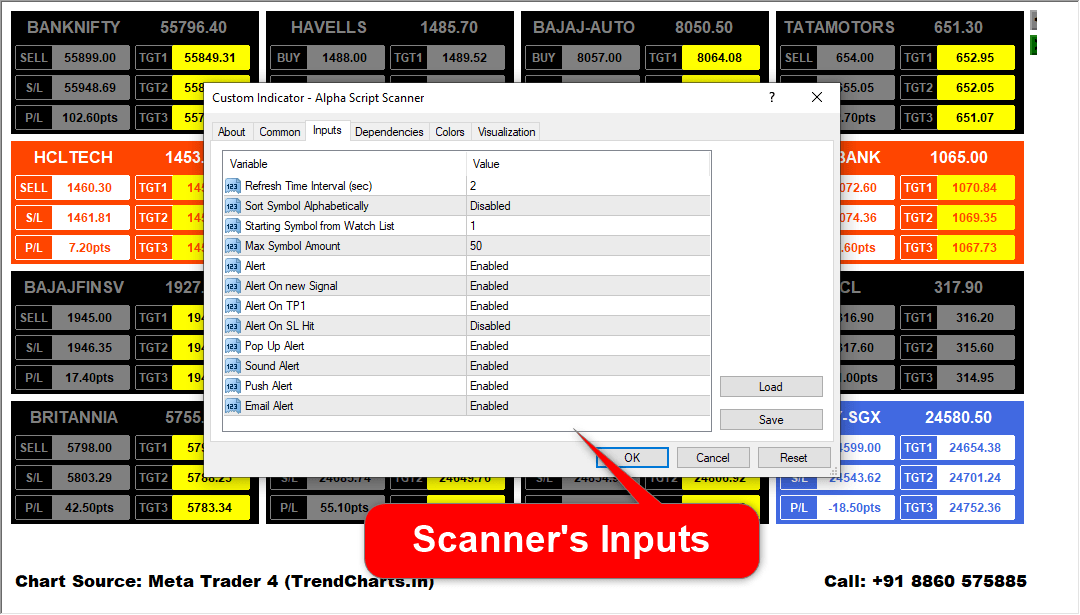
📈 Scan Up to 100 Stocks & Commodities: Efficiently monitor a vast array of assets without manual effort.
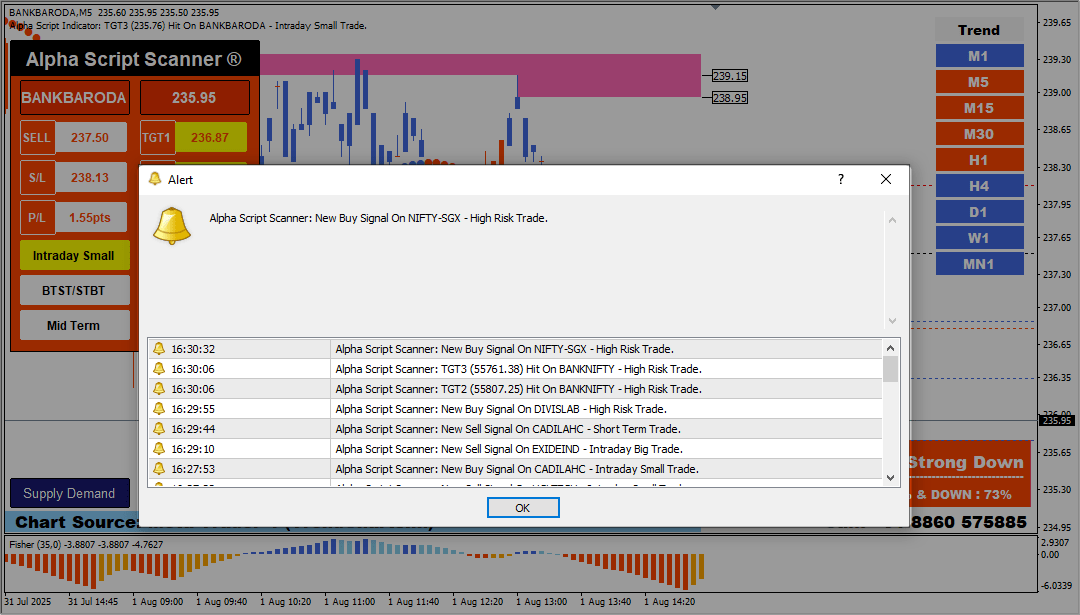
🔔 Give Buy-Sell Levels with Alert: Receive precise entry and exit points, accompanied by instant notifications.
🎯 03 Targets, Stoploss and Trailing Stoploss: Strategically manage your trades with multiple profit targets, a crucial stop loss, and a dynamic trailing stop loss for maximized gains and minimized risk.
💱 Compatible with MCX, Cash, Future-Options & Forex: A truly versatile tool, applicable across various segments of the financial market.
📢 Sound Alert and Popup on new signals: Stay informed with immediate audio and visual alerts for new trading opportunities.
🤖 No Need to Monitor Individual Scripts: Automate your market watch and focus on executing profitable trades.
Indicator Features
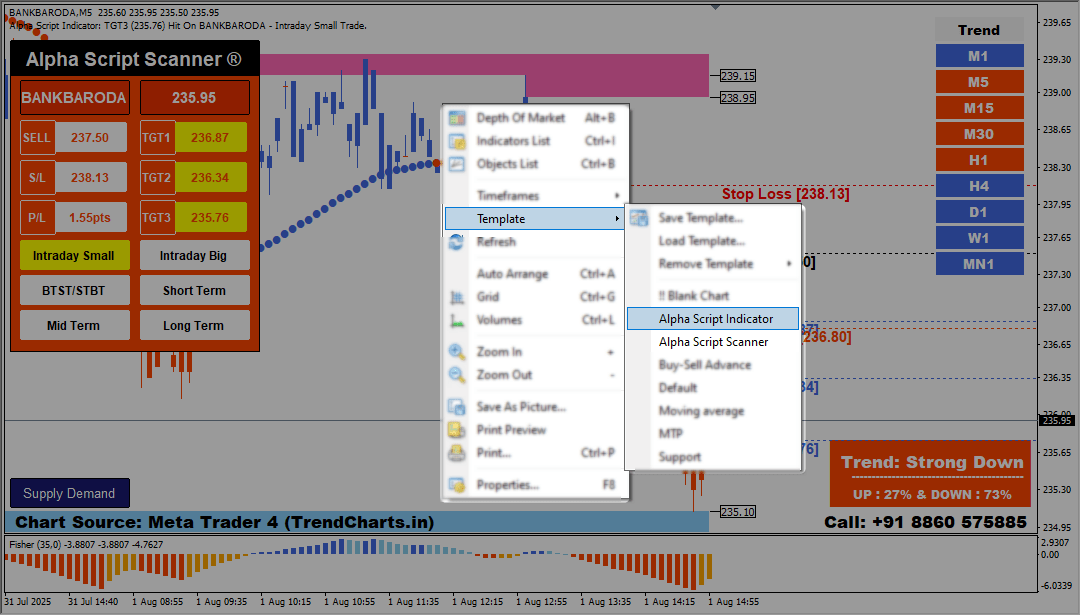
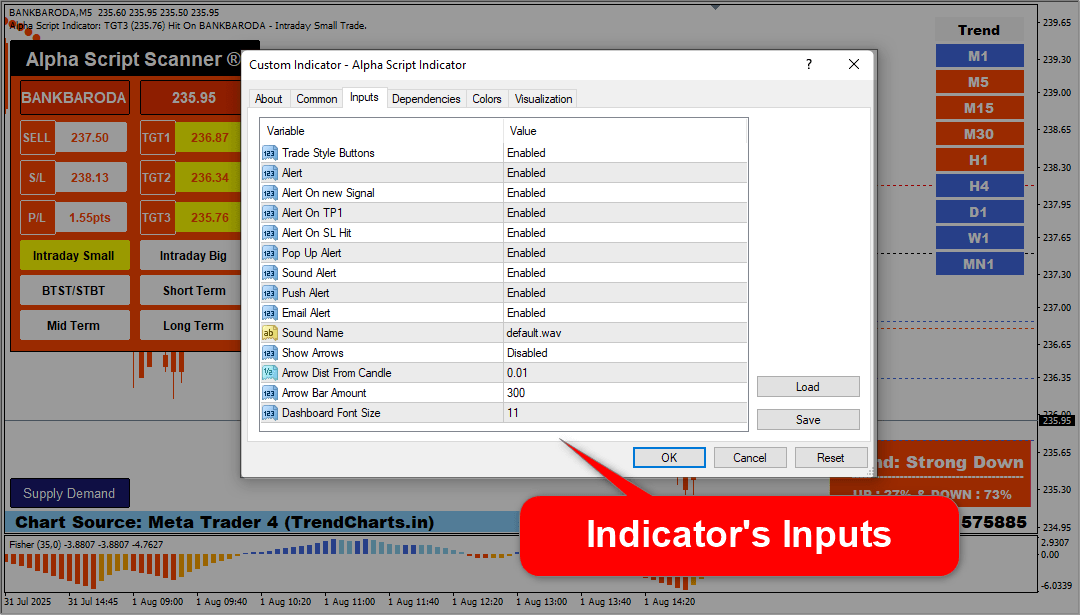
🔄 One Click to Change Trading Style (New Feature): Effortlessly switch between different trading approaches to match market conditions or your personal preference.
⚡ Intraday Small Targets (Scalping): Ideal for high-frequency traders seeking quick, small profits.
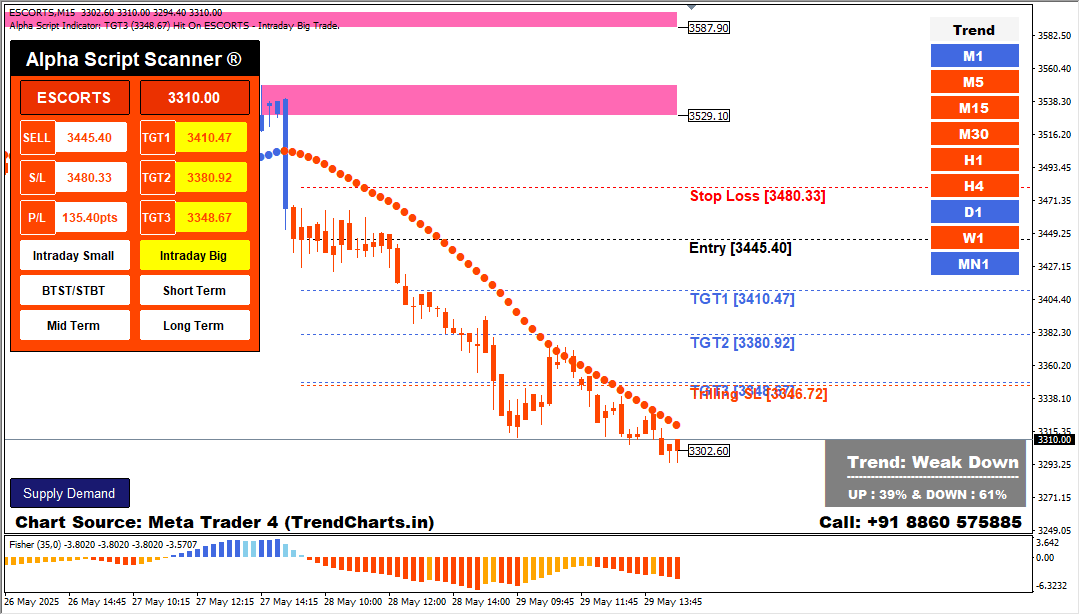
💰 Intraday Big Targets (Regular Traders): Suited for those looking for more substantial gains within a single trading day.
📅 BTST and STBT: Optimize your overnight positions with “Buy Today, Sell Tomorrow” and “Sell Today, Buy Tomorrow” strategies.
⏳ Short Terms Trades (5-10 Days Holdings): Capture medium-term market movements with strategic holdings.
🗓️ Long Terms Trades (15-30 Days Holdings): Position yourself for significant trends with extended holding periods.
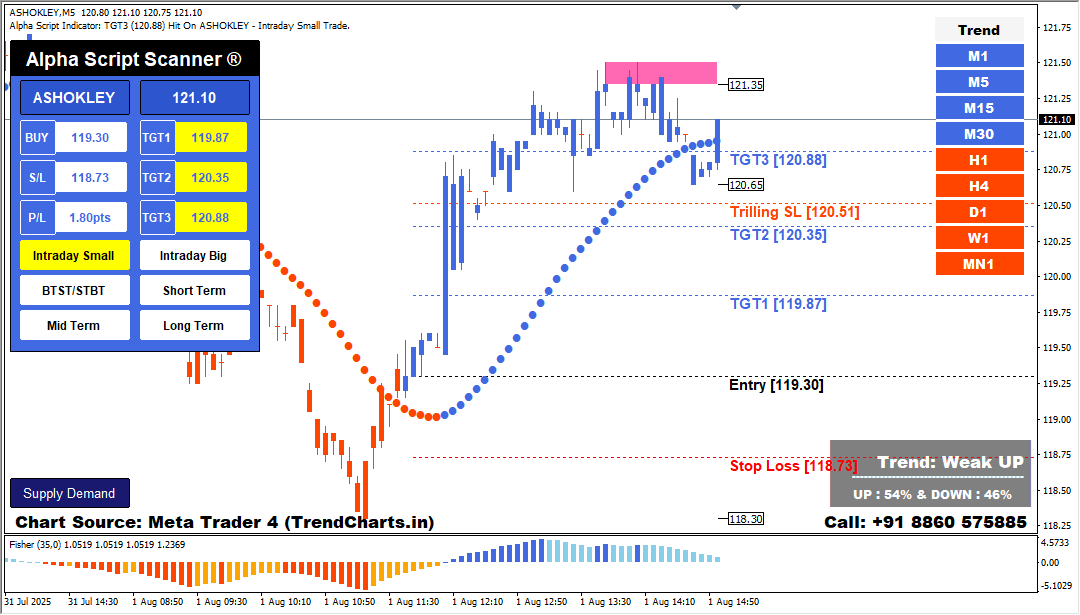
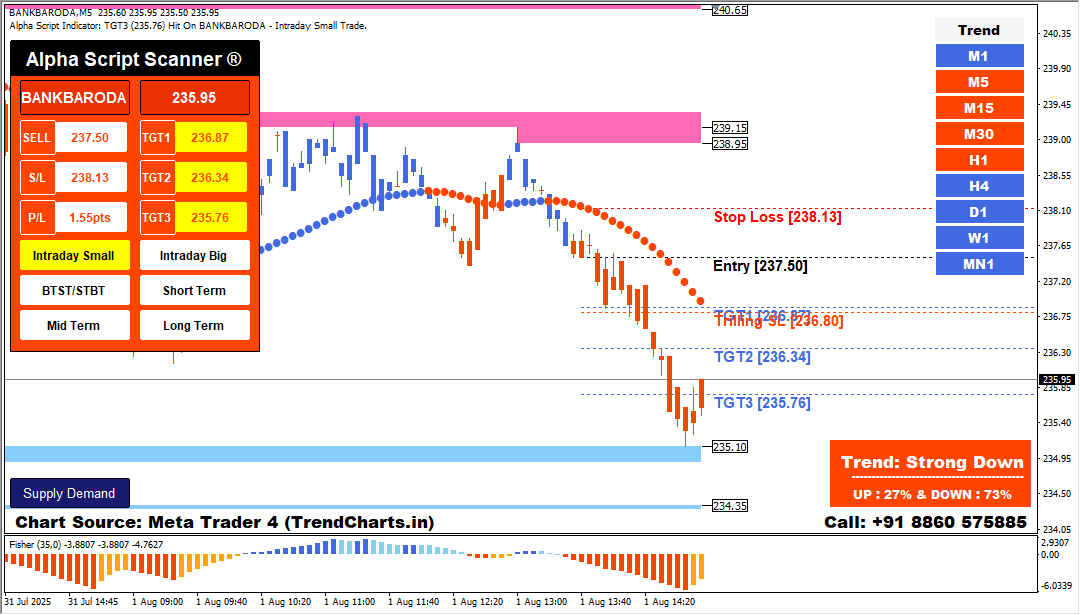
➡️ Entry Point (Buy/Sell Level) with Alert: Receive clear signals for optimal entry into trades, backed by instant alerts.
🛑 TGT 1, TGT 2, TGT3 Level & Stop Loss: Comprehensive target and risk management, providing clear profit-taking points and essential capital protection.
🔒 Trailing Stoploss for maximize profit and minimize risk: Secure your profits as the trade moves in your favor, and protect against sudden reversals.
⚖️ Supply Demand for Best Reversal Points (Price Action Based): Identify critical support and resistance levels for high-probability reversal trades, based on robust price action analysis.
⏰ Time Frame Scanner for showing Current Signal of all Time Frames: Gain a holistic view of market sentiment across various timeframes, aiding in robust decision-making.
📈 Mega Trend for Ultimate Trend Confirmation: Confirm the prevailing market trend with a powerful trend analysis tool, ensuring you trade with the dominant market direction.
💪 Strength Indicator for Current Alpha Trend Forecasting: Gauge the strength of current trends and forecast potential alpha opportunities with this insightful indicator.
📊 Live Movement and P&L Dashboard: Monitor your trades in real-time with a dynamic dashboard displaying live price movements and profit/loss figures.
🌐 Compatible with MCX, NSE-Cash, Futures-Options, Forex, etc.: Enjoy broad market compatibility, making this tool an indispensable asset for diverse trading portfolios.
🔔 Sound Alert and Popup on new signals: Never miss a potential trade with immediate audio and visual notifications.
How to Use
Check 01: All Levels on Chart
📈 Check the Arrow Signal and Price Level on Chart: Look for the indicator’s signal and the price levels.
🎯 You’ll get a Buy/Sell Level with Two Targets & Stop Loss: The indicator provides clear entry, profit, and exit points.
➡️ You just need to follow the given levels: Execute the trade based on the provided levels.
🤔 But these are Not Enough, Verify the signals with Other Indicators: Always use a multi-factor confirmation approach.
Check 02: Time Frame Scanner
⏱️ Time Frames are available 01 Minute to 01 Month: The scanner covers a wide range of time frames.
🔄 Check the Current Time Frame & One Lower Time frame: For confirmation, compare your current time frame with the one directly below it.
✅ Both should be the same, like: The colors of the time frames should match.
🔴 If trade on M5 then M1 will also be in same color: For example, if M5 is red, M1 should also be red.
⚠️ If Color not same, then wait till becomes into same: Do not enter a trade until the colors align.
Check 03: Trend Indicator
🟢🔴 The Red and Blue Dot Line is a Trend Indicator: This line confirms the market’s overall trend.
🐻 Red refers Bearish and 🟢 Green refers Bullish: Interpret the color to understand the trend direction.
🤝 Trend Must Match the Current Signal: The trend and the signal must be in agreement.
⬆️ If Arrow is Upside, then Dot Line must be in Green Color: A buy signal should be confirmed by a bullish trend.
⬇️ If Arrow is Downside, then Dot Line must be in Red Color: A sell signal should be confirmed by a bearish trend.
⏰ If Color is not the same, then wait till becomes into same: Wait for alignment before entering a trade.
Check 04: Supply Demand (Important)
📊 Supply Demand is Pure Price Action Based Indicator: This tool identifies key reversal zones.
🔴 Red is Supply Zone & 🔵 Blue is Demand Zone: These are the primary reversal points.
🔄 These Zones work as Reversal Points: Expect a potential trend change when the price hits these zones.
⬇️ If candle hit Supply Zone: Good possibility of trend to Downside.
⬆️ If candle hit Demand Zone: Good possibility of trend to Upside.
🚨 Remember, if candle is going to hit any zone, you need to keep eye on the script that time: Be vigilant as a reversal could happen.
🏃♂️ If the Price Reverses, Exit immediately: Close your position if the price changes direction.
➡️ If Price Breaks Zone, Keep Open Position for Next Level: If the price breaks through a zone, continue holding for the next target.
↔️ If found very Low gap between Supply & Demand, it refers: This indicates a sideways or range-bound market.
🚫 Sideway Market Condition (No Trade Zone) or Range Bound Market Condition (No Trade Zone): Avoid trading in these conditions.
📈 Wait till break any Zone: Wait for a clear breakout before considering an entry.
🖱️ Feature: One Click Show / Hide Button on bottom right Corner: A convenient button to manage the indicator’s visibility.
Check 05: Always Remember
🚫 Don’t take entry in Gap up or Down Candle: Avoid entering on volatile gap movements.
🚫 Don’t take entry if the signal is old: Only act on fresh signals.
🚫 Don’t take entry if all trends are not in same Direction: Ensure all indicators confirm the same trend.
✋ Always Ignore this type of Signal: Discard signals that don’t meet all the confirmation checks.
⏳ Always wait for the next Signal: Be patient and wait for a high-probability setup.
Risk Disclaimer
- TrendCharts.in and its associated products, services, software, and tools do not provide any offer or solicitation to buy or sell securities, futures, forex, commodities, or derivatives.
- We are not SEBI Registered Investment Advisors or Research Analysts.
- All materials are strictly for educational, informational, and paper trading & help in analysis purposes only.
- We do not provide advice for Real Money Trade, tips, buy/sell recommendations, or investment strategies.
- TrendCharts is solely involved in the development, sell, resale, and distribution of financial market software, datafeeds, indicators, scanners, and tools.
- All our offerings are intended for testing strategies and educational evaluation only—not for real-money trading.
- Users may utilize the software and tools for paper trading or strategy evaluation only.
- If users apply our offerings to actual trading (knowingly or unknowingly), TrendCharts.in or its stakeholders bear no responsibility for any profit or loss.
- Any such use is at the user’s sole discretion and risk.
- We explicitly disclaim liability for any financial loss, trading loss, or damages resulting from:
- Use of our software, tools, or services.
- Decisions made based on any charts, indicators, AFLs, data, or analysis from our products.
- All market data and content provided are subject to delays, inaccuracies, or errors.
- Past performance (actual or hypothetical) is not indicative of future results.
- Hypothetical or backtested performance may not reflect the impact of actual market conditions.
- Trading and investing involve substantial financial risk and can result in loss of capital beyond the initial investment.
- Users must use individual discretion and independent judgment while interpreting signals, strategies, or chart setups.
- Automated signals or scanners are tools for evaluation—not trading instructions.
- TrendCharts content does not account for personal financial conditions, goals, or investment profile.
- Before making any financial decisions, consult with a licensed financial advisor or SEBI-registered professional.
- Do not rely solely on any information presented on our site for actual trades.
- Datafeeds and information may be delayed as per data vendor policies or exchange requirements.
- We do not guarantee the real-time accuracy, timeliness, or completeness of such data.
- No legal claim may be made against us or our data providers based on inaccuracies.
- Any user testimonials are individual opinions and may not represent the typical user experience.
- Hypothetical performance results involve inherent limitations and should not be relied upon for real-money decisions.
- All opinions, data, signals, and analyses shared on the website are subject to change without notice.
- TrendCharts reserves the right to modify tools, content, and services at its discretion.
- Our software or product names are for branding purposes only and do not imply any market prediction or financial guarantee.
- No claim is made regarding profitability from any software usage.
- All content—charts, indicators, tools, or data—is designed for testing, analysis, and learning.
- No real-money trading or investment recommendations are provided or supported.
 Final Note: Trading in financial markets is speculative and may not be suitable for all investors. TrendCharts.in provides various automatic signal setups for Paper Trading & help in Analysis, it is not a “black box” system to be used without careful evaluation. Users must apply their judgment in filtering automated setups, particularly in relation to broader market trends. All trading decisions are solely the responsibility of the individual trader. Trading and investing involve risks, and losses are inevitable, So Kindly use only risk capital and never invest money you cannot afford to lose.
Always remember my 3R Rule: If the money is yours then, risk, reward and regret are solely yours.


Reviews
There are no reviews yet.