Indian Market Live Feed @ ₹ 400/Month or ₹ 3,600/Year.
Charges (₹ 4,500) Applicable in case of Reinstallation.
Request a Call Back
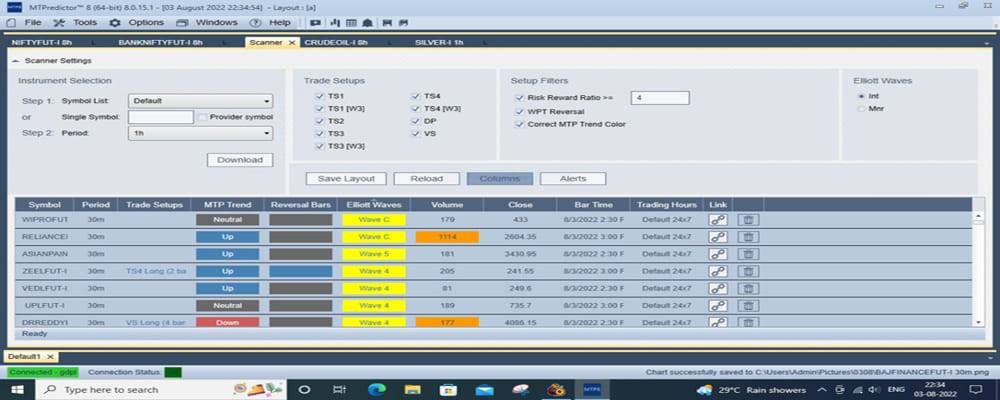
Automated Trade Setup Identification
It refers to the built in Trade Setups (TS) that are instantly recognized and displayed on your charts the moment they occur, requiring no manual input. These automatic setups appear in real time, giving traders immediate visibility of potential opportunities. Each Trade Setups (TS) is explained in straightforward trading language so you can clearly understand what the setup represents, when it appears, and how traders typically use it in practice.
Where it appears:
• TS1 – Continuation after Correction.
• TS2 – Continuation after Correction (More Complex).
• TS3 – ABC Correction Continuation.
• TS4 – ABC Correction Continuation (More Complex).
• W3 - Wave 3 Variations (of TS1, TS3, TS4).
• DP – Decision Point (Reversal / Exhaustion Setup).
• VS – Volume Spike Setup.
TS1 – Continuation after Correction
A trend pause/correction that’s likely to end and continue in the same trend direction.
Where it appears:
• In a strong uptrend or downtrend.
• After a pullback or sideways correction.
How traders use it:
• Enter in the direction of the main trend.
• Stop usually below/above the correction.
• Targets are projected automatically on Chart.
➡️ Think: “Trend is resting… now ready to continue.”
📊 TS2 – Continuation after Correction (More Complex)
A deeper or more complex correction than TS1, but still a trend continuation setup.
Where it appears:
• In trending markets.
• After a bigger or messier pullback.
How traders use it:
• Wait for confirmation (trigger bar / signal).
• Trade in the original trend direction.
• Often offers better R:R than chasing breakouts.
➡️ Think: “Trend pulled back harder, but structure still supports continuation.”
📊 TS3 – ABC Correction Continuation
A classic ABC corrective pattern inside a trend.
Where it appears:
• During trends.
• When price makes a 3-leg correction (A-B-C).
How traders use it:
• Enter at the end of C leg.
• Trade in trend direction.
• Very popular with Elliott Wave traders.
➡️ Think: “Correction is complete, next impulse leg is starting.”
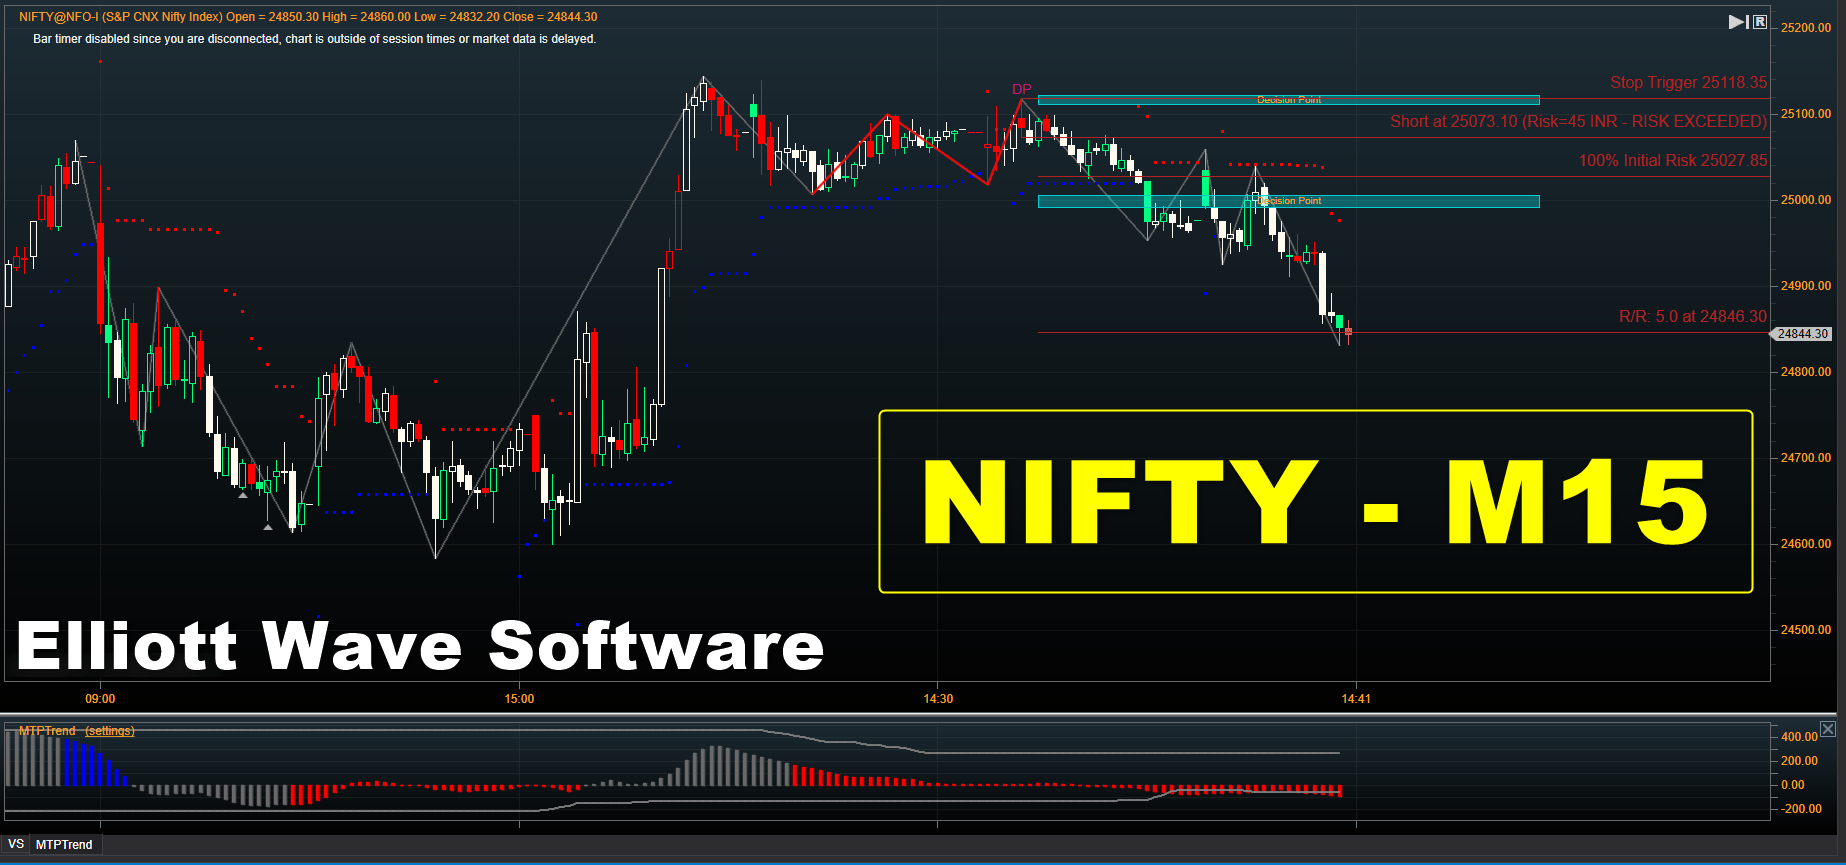
WPT zones are projected areas on a chart that anticipate where the next Elliott Wave swing is likely to end.
How it Works:
• They are calculated using clusters of Fibonacci price levels specific to the wave in question.
• Traders use these zones to forecast potential turning points in the market.
How traders use it:
• Designed to be used alongside a trader’s manual Elliott Wave count.
• The software provides options to select pivots (e.g., last pivot, pivots back, bar number) to display WPT targets.
➡️ Purpose: Helps traders identify high-probability support / resistance zones in advance, improving trade planning and risk management.