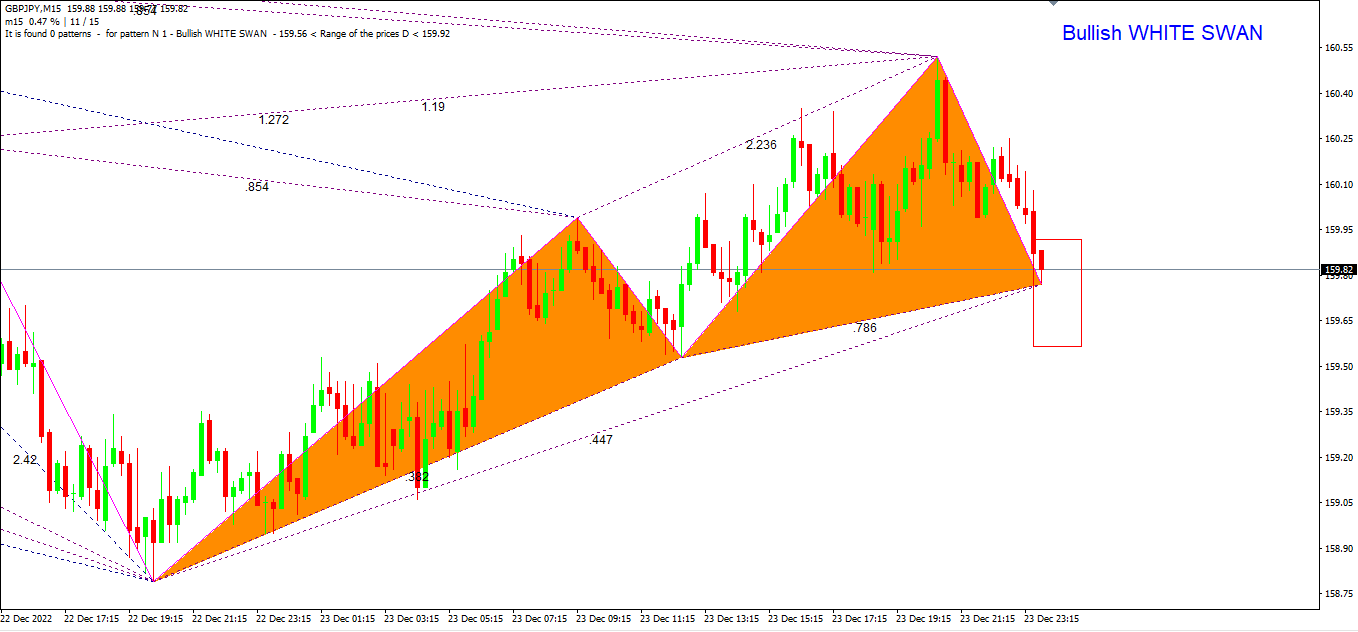
TrendCharts India

Independence Sale

(Up to 60% Discount)

MT4 Chart with Premium Scanners

Website is under Maintenance.

A Few Links, Pages, Price, etc. may not work.

How to use Alpha Script Scanner
Alpha Script Scanner
Steps to Open "Alpha Script Scanner"

Step 01- Open a Chart

  • Open your “Meta Trader 4
  • Open any new Chart Window-
      • File” > “New Chart” > Click on any Chart
Alpha Script Indicator

Step 02- Open Scanner

  • Right Click on Chart > “Template” > “Alpha Script Scanner
  • Wait for 20-30 seconds (Do not Click anywhere) > Scanner window will open
Alpha Script Scanner open like below
Alpha Script Scanner

Once your Alpha Script Scanner is opened, it will automatically give pop-up alerts on any new signal generated on any script of the scanner.

Pop-up alert will show like given in the image below. It will automatically come on the screen and give an alert sound.

Alpha Script Indicator Alert

Once any new Alert generated, just click on that script on the scanner and you will get a new chart window of that script. New Charts window name “Alpha Script“. It will show you Buy-Sell Level with Targets and Stop Loss. It will also give multiple confirmations of a new signal.

Alpha Script Indicator open like below
This whole strategy comes with many Indicators.
Let us check them One by one...
01. Alpha Script Indicator 

Check the Buy/Sell Level, Target 01 and Stop Loss.

All Levels Given in Simple Charting PreviewGiven levels are not enough for a perfect trade position. You also need to follow the Demand & Supply and Mega Trend Indicator for minimizing the chance of Losses.

02. Trailing Stop Loss Line

You need to modify your stop loss as per the level of this line.

It helps you in minimizing the risk of your current position and maximizing the profit.

03. Alpha Timeframe Scanner

Always check 1 lower timeframe Trend before entry. Lower Time frame must be same trend.

Shows trends on different timeframes. It helps you in finding trends in different timeframes on without any click. 

04. Demand and Supply Indicator (Most Important)

The Demand and Supply zone indicator is quite easy to use.
Color Indications:
→ Strong Supply
█ → Weak Supply 

→ Weak Demand

 → Strong Demand 

It also has the feature of One Click Show / Hide. Button is available in Bottom-Right Corner.

Demand & Supply

Here, Price hit Demand Zone and Bounce Up. So Trader can predict the Exit of the current Short Sell positions. 

Also, Trader can get Confirmation of his New Buy Entry.

Demand & Supply 3

Here, Price hit Demand Zone and Bounce Back Down. So Trader can predict the Exit of the current Buy positions. 

Also, Trader can get Confirmation of his New Entry of Short Sell.

Demand & Supply

Here, Both Demand and Demand Supply Zones are nearby. So It is a type of Sideway or we can say Range Bound Condition.  So Treder should avoid taking any new entries.

Also, Close existing they can close existing or Open Positions.

Fibo Points: It can Auto plot Fibo Points from the Demand / Supply Level. You can enable or disable it from the settings.

Remember: This Demand & Supply Indicator is not based on any mathematical calculation of Open, High, Low and yesterday’s Close. It is based on previous Price actions and Candle Patterns. So do not confuse with other Indicators having similar or same names.


05. Mega Trend (Based on HMA)

Green and Red Dotted Line is known as Mega Trend Indicator. This indicator shows the Current Market Trend on the bases of Price Actions.

Green Dot Line: Bullish Trend
Red Dot Line: Bearish Trend
If Mega Trend is not in favorable condition, Treder should avoid the new entry.

06. Fisher Transform (Based on MACD)

Green and Red Bar shows the Current Market Trend on the bases of Price Actions.

Green Bar: Bullish Trend
Red Bar: Bearish Trend
If Fisher is not in favorable condition, Trader should avoid the new entry.

07. Alpha Script Dashboard

The dashboard is available on the Left-Top Corner and shows you details of:

  • Buy/Sell Levels
  • 02 Targets
  • Stop loss 
  • Current Profit or Loss
  • Booked Profit or Loss
Few points also kept in mind (ALWAYS )

Point 01

Do Not take entry in GAP UP or GAP DOWN Condition.
Wait for next signal.

Point 02

Do Not take entry if the signal is old.
Wait for a new signal.

Alpha Script Indicator

Point 03

Do Not take entry if all trends are not in same Direction. Wait for a Perfect Position 

-----------
How to modify settings
  • Open Alpha Script Scanner
  • Right Click on Alpha Script Scanner Chart-
      • Right Click” on Scanner > “Indicator List
  • Select Alpha Script Scanner
      • Double Click on “Alpha Script Scanner” > Click on “Inputs
      • Make required changes > Click on “OK” > Click on “Close
      • Wait 20-30 second (Do not Click anywhere) > Scanner window will open with New Settings
Scanner Inputs Settings​

Note-

  • For Enabling “Value” for making changes, you have to double click on specified Value.
  • i.e. If you want to change in Refresh Time Interval (sec) you need to double click on “1”.

Common Settings

    • Starting Symbol Number in Watchlist-The number in the watchlist from Scanner pick the script
    • Maximum symbols on Charts- Number of Script, view on Chart
    • Short Symbols Alphabetically- Simply True or False (as you want)

Alert Signal

    • When New Signal Triggered- Simply True or False (as you want)
    • When TP# 1 Hit- Simply True or False (as you want)
    • When TP# 2 Hit- Simply True or False (as you want)
    • When SL Hit- Simply True or False (as you want)

and more alerts- Simply True or False (as you want)

If something wrong happened, Click on “Reset” 

Make required changes & Click on “OK” and then “Close“.

Your Scanner will Open with New Settings

————————

Alpha Script Scanner Pricing
  • Alpha Script Scanner
  • Alpha Script Indicator
  • Advance Demand Supply
  • Time Frame Scanner
  • Lime Market Support
  • Alpha Script Scanner
  • Alpha Script Indicator
  • Advance Demand Supply
  • Time Frame Scanner
  • Lime Market Support
  • All Segments Data Feed
  • Inbuilt Indicators
  • 25+ Complementary Indicators
PAYMENTS OPTIONS
UPI ID- trendcharts@axisbank
Google Pay- 8860 575885
Phone Pay- 8860 575885
Paytm- 888 188 9972
-------------------------------
A/C Transfer
BANK- AXIS BANK
A/C NO.- 919010053895842
IFSC CODE- UTIB0003428
NAME- ABHISHEK SINGH RAJPUT
Pay & Send Screenshot on +91 8860 575885
Independence-Day-PNG-Picture

Independence Sale

Ends in
Days
Hours
Minutes
Seconds