Alpha Script Scanner Features
01-02 Signals per day with Good Targets & SL for Intraday & BTST/STBT Only.
- Scan Up to 100 Stocks & Commodity.
- Give Buy-Sell Levels with Alert.
- 03 Targets, Stoploss and Trilling Stoploss.
- Compatible with MCX, Cash, Future-Options & Forex.
- Sound Alert and Popup on new signals.
- No Need to Monitor Individual Scripts.
Alpha Script Indicators
Indicators have all levels shown as above. You just need to follow the given levels.
- One Click to Change Trading Style. (New Feature)
- Intraday Small Targets (Scalping).
- Intraday Big Targets (Regular Traders).
- BTST and STBT.
- Short Terms Trades (5-10 Days Holdings).
- Long Terms Trades (15-30 Days Holdings).
- Entry Point (Buy/Sell Level) with Alert.
- TGT 1, TGT 2, TGT3 Level & Stop Loss.
- Trilling Stoploss for maximize profit and minimize risk.
- Supply Demand for Best Reversal Points (Price Action Based).
- Time Frame Scanner for showing Current Signal of all Time Frames.
- Mega Trend for Ultimate Trend Confirmation.
- Strength Indicator for Current Alpha Trend Forecasting.
- Live Movement and P&L Dashboard.
- Compatible with MCX, NSE-Cash, Futures-Options, Forex, etc.
- Sound Alert and Popup on new signals.
Prospect of Alpha Script Indicator
- Stop Loss Level – 15%
- Target 01 Level – 80%
- Target 02 Level – 65%
- Target 03 Level – 50%
Pricing of Alpha Script Scanner and Indicator
Above Price Includes
- Alpha Script Scanner
- Alpha Script Indicator
- Time Frame Scanner
- Supply Demand Indicator
- Mega Trend Indicator
- Script Changer Buttons
- Live Strength Indicator
- Live Market Support
- Full Scanner Training
Datafeed additional @ 400/Month or 3900/Year.
How to Use "Alpha Script Scanner"
Complete Uses, Features and Training Guide.
Table of Contents
Suggested Time Frame (Signals Based)
- M5: Intraday (Small Targets).
- M15: Intraday (Big Targets)
- M30: BTST or STBT.
- H1: 05 – 10 Days Holdings.
- D1: 15 – 30 Days Holdings.
- M1, W1 & MN not Suggested.
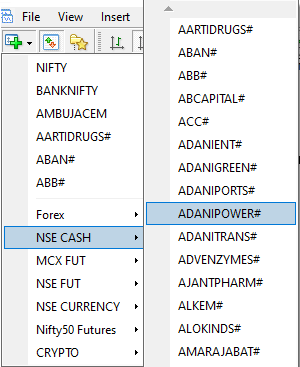
Step 01: Open a Chart
- Open your “Meta Trader 4“
- Open any new Chart Window-
- “File” > “New Chart” > Click on any Symbol.
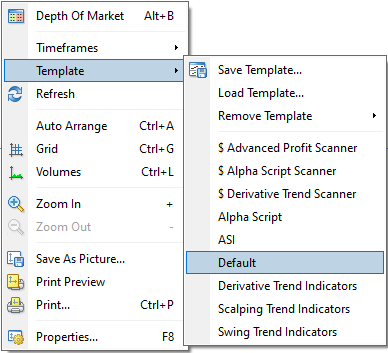
Step 02: Open Scanner
- Right Click on Chart > “Template“ > “Alpha Script Scanner“
- Wait for 20-30 seconds (Do not Click anywhere)
- It is reading all charts and current Signals of chart.
- Otherwise MT4 will Hang.
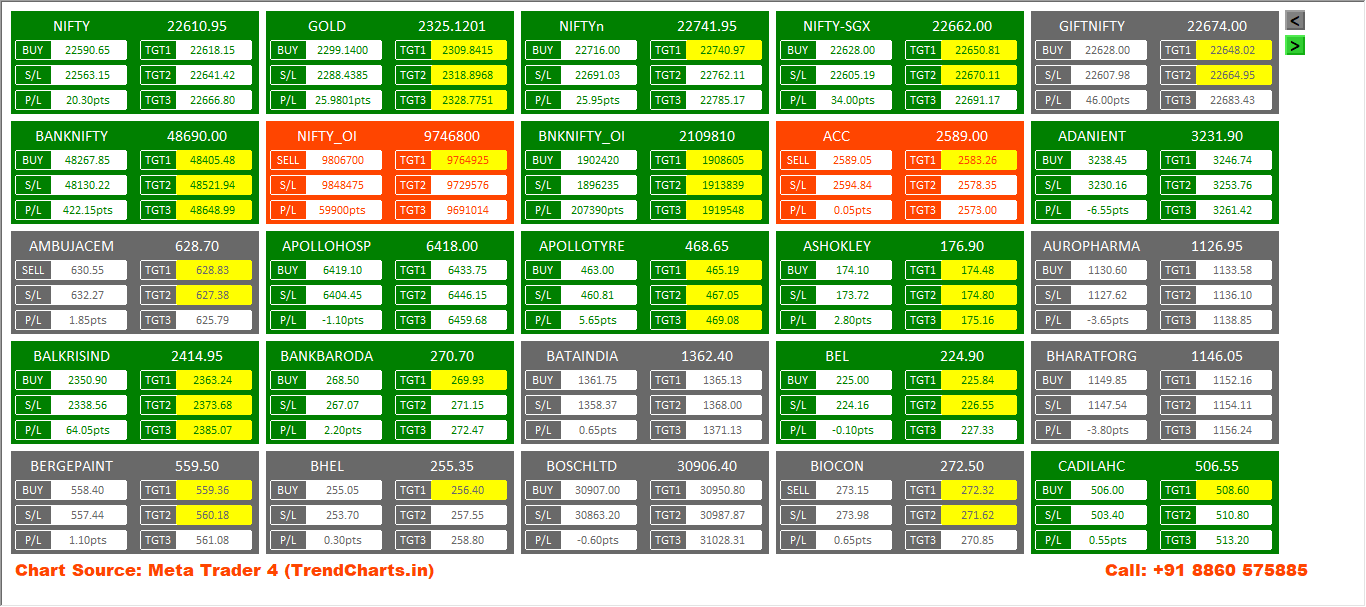
Scanner Window
- The Scanner window will open Live this.
- Now, it will automatically give pop-up alerts on every new signal generated on any script of the scanner.
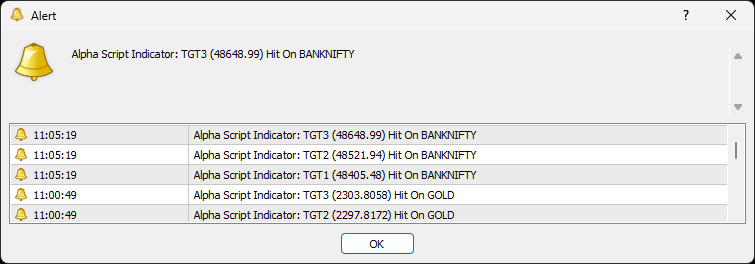
Alert Window
- Pop-Up Alert Window will show like this.
- It will automatically come on the new signal with alert sound.
- In Alert, the Symbol Name & Timeframe mentioned.
Step 03: Open Indicator
- Click on that symbol on the scanner. Chart window will open.
- New Charts window name is “Alpha Script“.
- It has many indicators, Now Check all Indicators one by one.
Practice full strategy several times on Paper Trade for Satisfaction.
Complete your full Analysis before taking any stand.
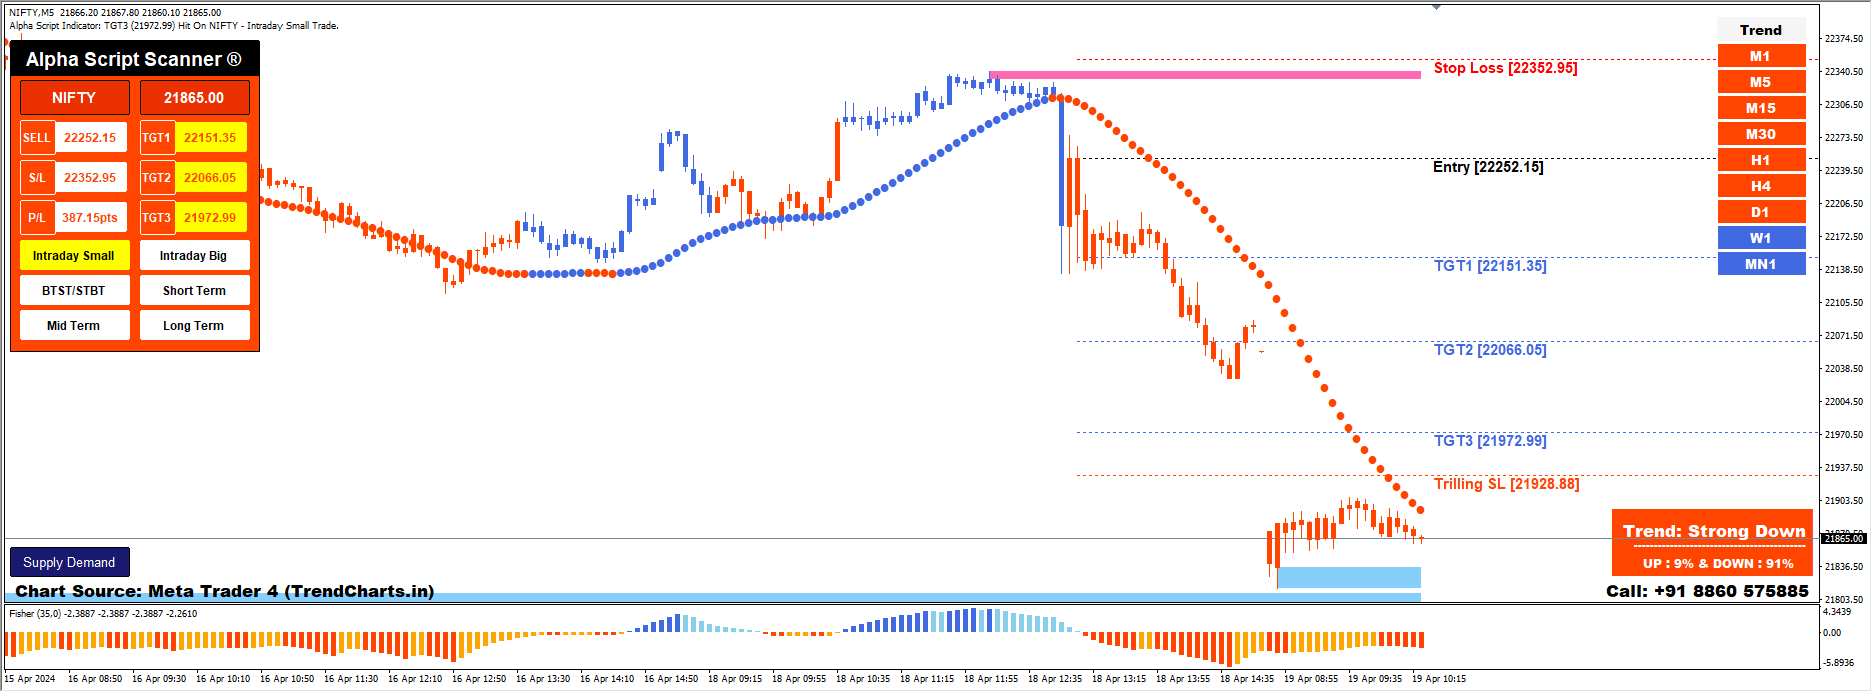
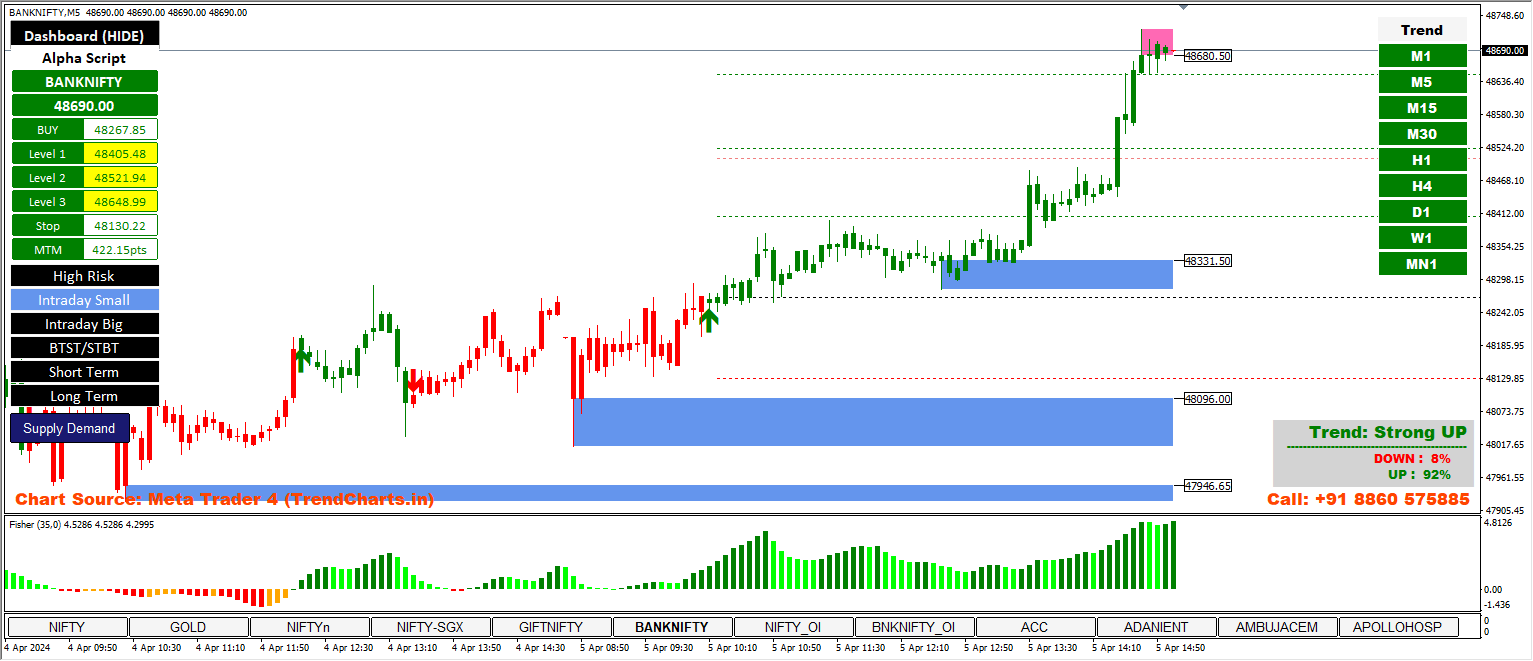
Check 01: All Levels on Chart
- Check the Arrow Signal and Price Level on Chart.
- You’ll get a Buy/ Sell Level with Two Targets & Stop Loss.
- You just need to follow the given levels.
But these are Not Enough, Verify the signals with Other Indicators.
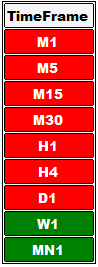
Check 02: Time Frame Scanner
- Time Frames are available 01 Minute to 01 Month.
- Check the Current Time Frame & One Lower Time frame.
- Both should be the same, like
- If trade on M5 then M1 will also be in same color.
- Like M5 in Red Color & M1 in Red Color.
- If Color not same, then wait till becomes into same.
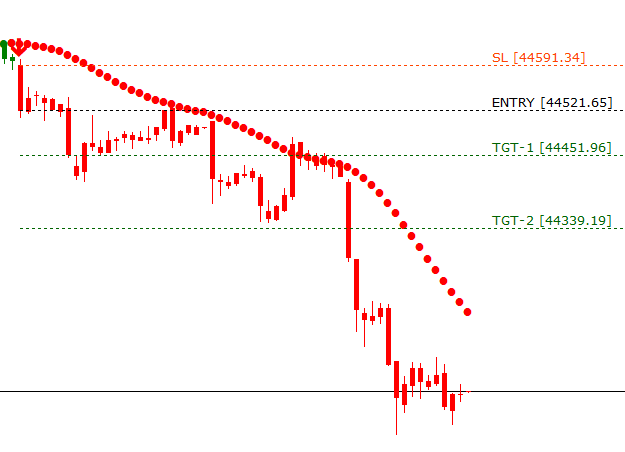
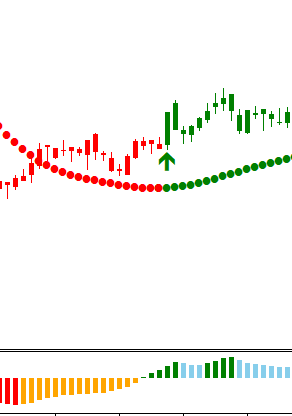
Check 03: Trend Indicator
The Red and Blue Dot Line is a Trend Indicator.
- Red refers Bearish and Green refers Bullish.
- Trend Must Match the Current Signal like
- If Arrow is Upside, then Dot Line must be in Green Color.
- If Arrow is Downside, then Dot Line must be in Red Color.
- If Color is not the same, then wait till becomes into same.
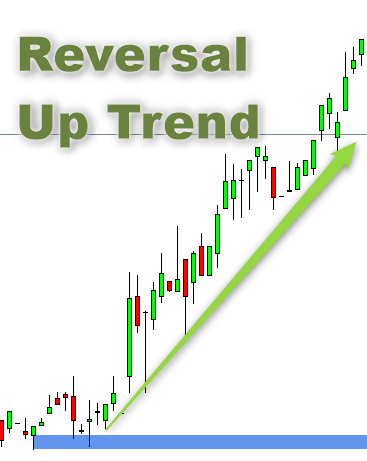
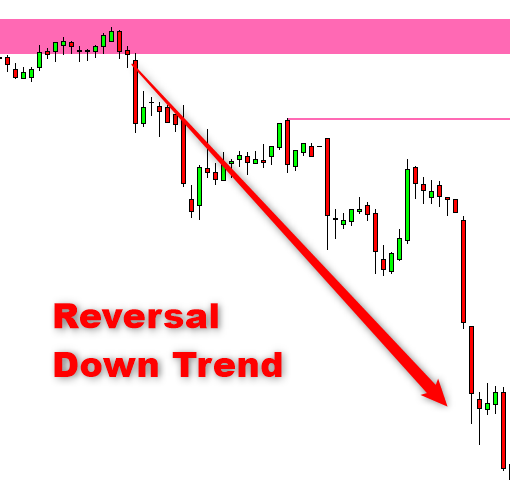
Check 04: Supply Demand (Important)
Supply Demand is Pure Price Action Based Indicator.
- Red is Supply Zone & Blue is Demand Zone.
- These Zones work as Reversal Points.
- If candle hit Supply Zone ⇒ Good possibility of trend to Downside.
- If candle hit Demand Zone ⇒ Good possibility of trend to Upside.
- Remember, if candle is going to hit any zone,
- You need to keep eye on script that time. It can be reversed.
- If the Price Reverses, Exit immediately.
- If Price Break Zone, Keep Open Position for Next Level.
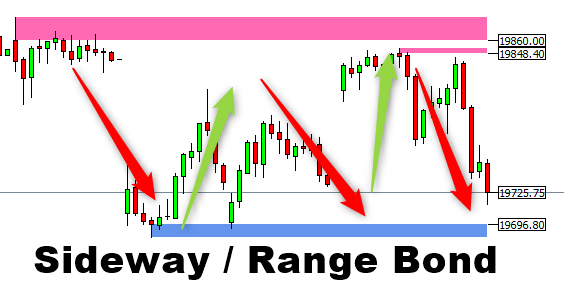
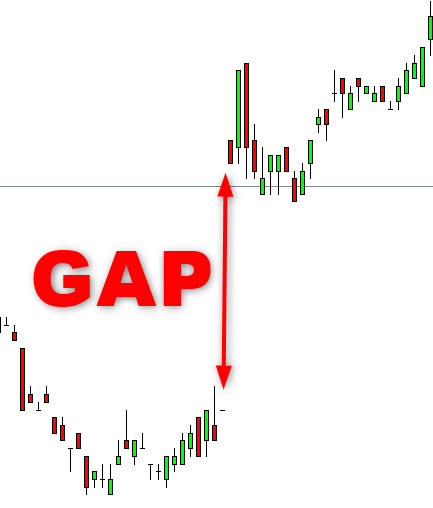
- If found very Low gap between Supply & Demand, if refers
- Sideway Market Condition (No Trade Zone) or
- Range Bound Market Condition (No Trade Zone).
- Wait till break any Zone.
- Feature: One Click Show / Hide Button on bottom right Corner.
Check 05: Always Remember
- Don’t take entry in Gap up or Down Candle.
- Don’t take entry if the signal is old.
- Don’t take entry if all trends are not in same Direction.
Always Ignore this type of Signal.
Always wait for the next Signal.
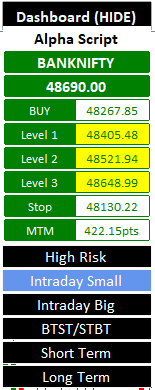
Other: Dashboard
- Color Denotes:
- Red Refers to Bearish,
- Green Refers to Bullish &
- Gray Refers to No Signal.
- Information on Dashboard
- Buy / Sell, TGT 1, TGT 2, TGT3,
- Stop Loss and MTM.
- One Click Change Trading Style.
- Intraday, BTST/STBT, Positional.
- One Click Show / Hide Button on Top Left Corner.
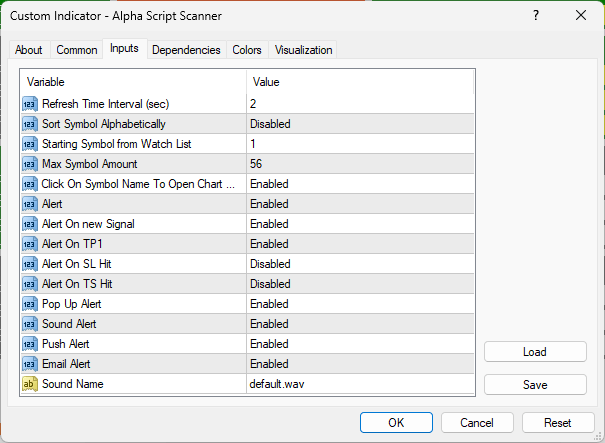
Settings: Scanner
- First Open Scanner from Templates.
- Right Click on Chart > Indicators List,
- Double Click on Alpha Script Scanner > Inputs,
- Double Click for Edit any Section,
- Do Required Changes like
- Starting Number, Max Symbol, Alerts, etc.
- Now Click OK > Close.
- Scanner will open with New Settings in 30 seconds.
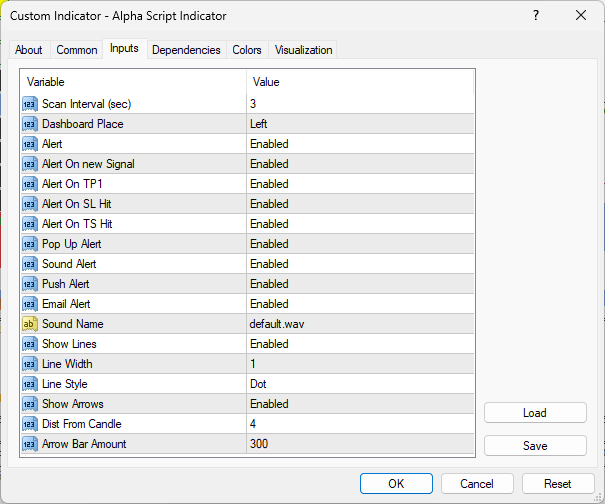
Settings: Indicator
- First Open Indicator from Templates.
- Right Click on Chart > Indicators List,
- Double Click on Alpha Script Indicator> Inputs,
- Double Click for Edit any Section.
- Do Required Changes like
- UX Location, Alerts, etc.
- Now Click OK > Close.
- Indicator will open with New Settings in 10 seconds.
Points Keep in Mind
- Never Open the Scanner in Multiple Charts / Tabs.
- Do not open unnecessary charts.
- Close all charts before closing MT4.
- In case of Software hangs, Restart MT4 then Close all charts.
- In case of New Installation, Software may slow for 2-3 Days.
- While opening Scanner, Wait for 20-30 Seconds for opening Scanner.

Scanner Not Working or any Error?
If you got any error Like “Blank Screen” or “License check failed!” or “Activation check failed!“. Let’s try to fix it.
First: Apply “Alpha Script Indicator” form Templates.
- Check Internet Connection.
- If Internet Working…
- Close all Charts.
- Restart MT4 Then Open a new Chart.
- Check Subscription Expiry Date.
- If Subscription Expired…
- Renew Immediately and use.